What "emotions affecting trading" actually means
Most discussion of emotions in trading is shapeless. "Stay disciplined." "Don't trade on tilt." "Manage your psychology." None of it tells the trader what specifically to watch for, or what specifically to fix.
The behavioral finance literature is more precise. It identifies the specific moments where emotional state changes trade outcome, and it has measured the size of those effects across thousands of accounts. The aggregate finding is consistent: emotional state at the moment of decision is not a small variable in trader performance. It is one of the largest non-strategy variables.
That doesn't make every trader equally affected. But it does mean that the question "is psychology costing me money" has an answer in the data, not in the trader's self-narrative.
Four mechanisms behavioral finance has mapped
Four findings have held up across decades of replication. Each is a specific, measurable behavior pattern that connects emotional state to trade-level outcomes. Together they cover most of the structural ways emotions show up in a trade log.
Loss aversion
Kahneman and Tversky's 1979 prospect theory [1] established that losses feel approximately twice as bad as equivalent gains feel good. This is the slope of the value function in the original paper, not a metaphor. The asymmetry shows up consistently in lab and field studies and has been replicated across cultures and decision domains.
In trading, loss aversion drives two specific behaviors: holding losing positions longer than the strategy calls for (in hope of getting back to breakeven), and sizing into recovery trades immediately after losses (the make-it-back trap covered in drawdown recovery math).
The fingerprint in the trade log: a measurable gap between the trader's planned stop loss and the price they actually exited at, biased toward holding losers too long.
Disposition effect
Shefrin and Statman's 1985 paper [2] in the Journal of Finance named what every trader already knew: you hold losers too long and cut winners too short. The disposition effect is the empirical observation that retail traders close winning positions at a much higher rate than losing positions of equivalent age and size.
The behavior feels rational in the moment. "I should lock this win in." "This losing one will come back." But it inverts the trader's stated expectation. Trades the trader thought were edge are closed before the edge materializes. Trades the trader thought were stop-out are held past the stop. Over time, the strategy's planned R-multiple collapses — anchor numbers like 2R or 3R become 1.2R or 0.8R because the winners aren't held long enough.
Forty years later, the research is settled. The behavior hasn't changed. Use the risk/reward calculator to see what the planned R looks like before the disposition pressure kicks in.
Overconfidence
Barber and Odean's study of 66,465 brokerage accounts [3] found the most active traders earned 11.4% annually while the market returned 17.9% — the gap driven largely by the costs of overtrading.
Overconfidence isn't just trading too much. It's the trader-side mechanism where a series of wins produces an emotional state ("I've got this") that quietly changes downstream decisions: bigger positions, looser stops, fewer setup checks, more trades.
The fingerprint: position size that drifts upward through a winning streak. Trades on names the trader doesn't normally take. Reduced time between setup screen and entry click. Use a position size calculator before market open and write the number down, so the post-streak trader can't quietly override what the pre-streak trader decided.
Arousal and cognitive narrowing
Lo, Repin, and Steenbarger's 2005 paper on day traders [4] measured physiological responses (heart rate, skin conductance, breathing) in real time during trading sessions. Traders who showed lower emotional reactivity to market events performed measurably better than peers with high reactivity.
The mechanism is well-established in psychophysiology: arousal narrows the range of cues a decision-maker attends to. Coates and Herbert's 2008 study on cortisol [5] found traders' cortisol rose with the volatility and uncertainty of their P&L — and the broader stress literature ties elevated cortisol to degraded working memory and impulse control, exactly the functions disciplined trading needs.
The fingerprint: trade decisions made within minutes of a loss show systematically different sizing, exit timing, and setup-tag profiles than calm-state decisions made earlier in the same session.
The fingerprint each leaves in your own trade log
The four mechanisms above are not abstractions. Each shows up in a specific, identifiable pattern in a trader's own data:
A measurable gap between the planned stop and the actual exit — biased toward holding losers too long.
Winning trades closed faster than losing trades of equivalent age and size.
Position size drifting up through a win streak; trades on names you don't normally take.
Trades within 30 minutes of a loss show different sizing, exits, and setup tags than calm-day trades.
Each is measurable from timestamps and dollar amounts. None requires the trader to remember how they felt. The numbers do the work.
The four mechanisms above are the most-replicated examples. Specific trader behaviors that get their own names — revenge sequences, FOMO entries, drawdown-deepening size drift — are instances of these mechanisms playing out in concrete trade patterns.
Where to go deeper
Each of the high-leverage emotional patterns has its own dynamics worth understanding in detail.
- How to stop revenge trading — the post-loss × short-re-entry-interval sequence. Loss aversion plus arousal narrowing, playing out as a measurable pattern in a trader's log, and three structural defenses against it.
- FOMO trading psychology — chase entries driven by regret aversion plus informational cascades. The fingerprint of chasing what already moved, and how to break the sequence before the click.
- The drawdown recovery math — why the math punishes deep drawdowns asymmetrically (50% requires 100% to recover; 90% requires 900%), and how position-sizing discipline through behavioral pressure determines where on the curve a trader actually lands.
Each article walks one specific mechanism, its trade-log fingerprint, and the structural defenses that work better than willpower.
Why measurement is the gap
A trader can read every behavioral finance paper and still not know whether they specifically do the thing the paper describes. Knowing the rule is not the same as seeing the rule violated in your own trades.
The literature's findings are aggregate. Some traders are heavily affected by the disposition effect; some are not. Some traders' performance collapses around losses; some show no measurable arousal effect. Self-narrative ("I'm pretty disciplined about my stops") is a notoriously poor predictor of which group a given trader belongs to.
The only way to know is to measure your own trades against your own baseline. Per-trader effects are noisy on small samples: under 30 trades, almost any pattern looks like signal. Past 50 trades the real patterns start to separate from noise. Past 100 trades, the trader has enough data to know which mechanisms are personally costly and which are not personally relevant.
This is the gap behavioral finance research can't close on its own. Aggregate findings don't tell an individual trader where they are on the curve. Their own data does.
The measurement layer
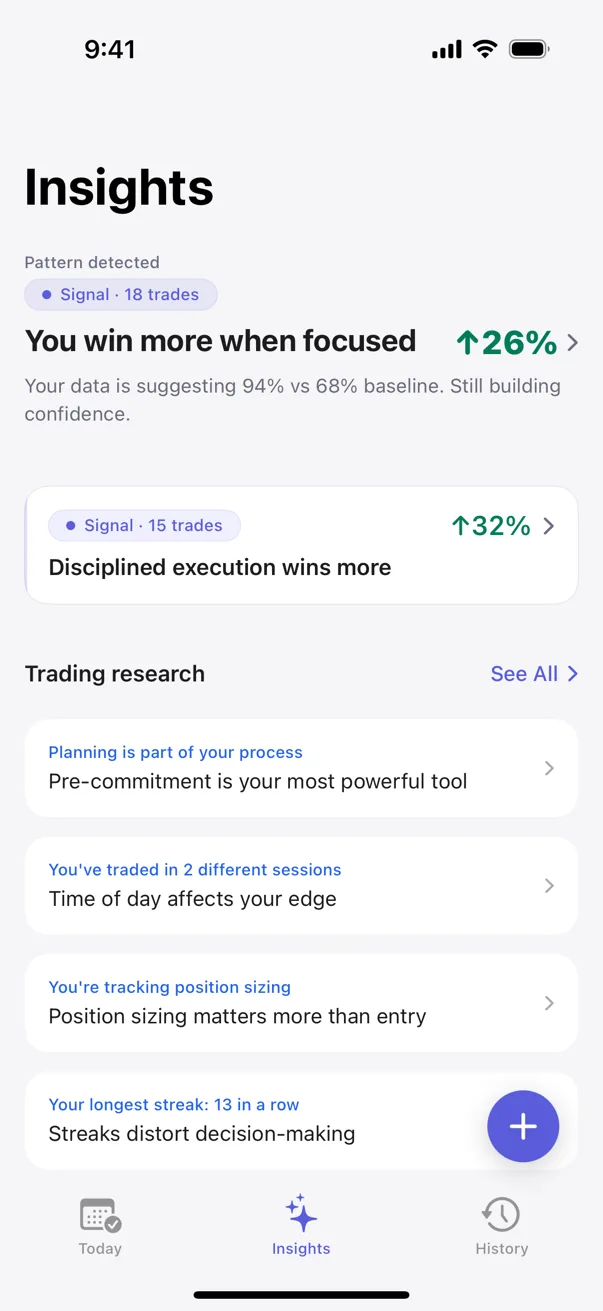
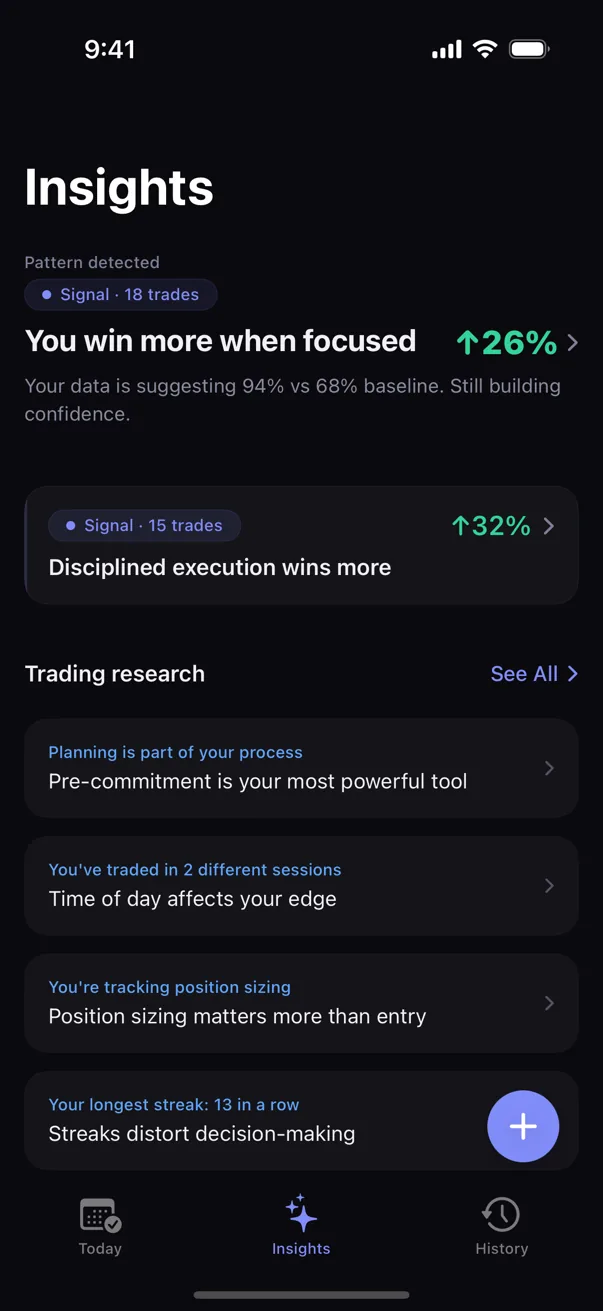
Behavioral pattern detection — running statistical tests across a trader's own trade history — closes that gap. The output is not a warning ("watch out for overconfidence"). It is a measurement: trades you logged after three consecutive wins, where your position size was above average, returned X% less per trade than your baseline, with a confidence range that tightens as your sample grows.
That number is harder to argue with than a generic warning. It's also harder to ignore, because it's pulled from the trader's own money.
Kyra Trading is a private trading journal that does this detection on-device. Every pattern surface includes the sample size and a confidence range, so the trader can see how strong the signal is. Nothing leaves the device. Pattern detection runs locally, no accounts, no servers. The trader's data stays the trader's data.
Sources
- Kahneman, D., & Tversky, A. (1979). Prospect Theory: An Analysis of Decision under Risk. Econometrica, 47(2), 263–291.
- Shefrin, H., & Statman, M. (1985). The Disposition to Sell Winners Too Early and Ride Losers Too Long: Theory and Evidence. The Journal of Finance, 40(3), 777–790.
- Barber, B. M., & Odean, T. (2000). Trading Is Hazardous to Your Wealth: The Common Stock Investment Performance of Individual Investors. The Journal of Finance, 55(2), 773–806.
- Lo, A. W., Repin, D. V., & Steenbarger, B. N. (2005). Fear and Greed in Financial Markets: A Clinical Study of Day-Traders. American Economic Review, 95(2), 352–359.
- Coates, J. M., & Herbert, J. (2008). Endogenous steroids and financial risk taking on a London trading floor. Proceedings of the National Academy of Sciences, 105(16), 6167–6172.
Educational only. Not financial or trading advice. Behavioral patterns described above are observations from the published literature; specific outcomes vary with strategy, market conditions, and individual circumstances.