What overtrading actually is
Overtrading is not a volume number. A scalper who takes forty trades a day inside a tested, repeatable setup is not overtrading. A swing trader who takes a fourth trade in a quiet week — one they would have skipped on a disciplined day — is. The difference is not how many trades you take. It is whether the trade is one your edge supports.
The clean test is the marginal trade: the one at the edge of your day, the one you would not have taken if the screen had looked slightly less interesting or your account had been slightly less restless. On a disciplined day you skip it. On an overtrading day you take it, and you take it for reasons that have nothing to do with the setup in front of you.
This is the line between two kinds of active trader:
Inside the edge
Many trades, each one a setup the strategy has tested and the trader would take again on a fresh day. Volume is high because the edge fires often, not because the trader is reaching.
Beyond the edge
Extra trades the strategy doesn't support, taken to stay busy, to chase, or to recover. Volume is high because the trader is reaching — and the reach is what costs.
Overtrading is the second column. The fix is not "trade less" in the abstract. It is "stop taking the trades past the edge" — and that requires knowing where the edge ends.
Why it happens
The marginal trade rarely announces itself. It arrives wearing the costume of a real setup, pushed by one of a few well-documented drivers. None of them is a discipline failure in the moral sense; each is a predictable response to the state the trader is in.
Action bias and boredom. A flat screen feels like wasted time. The urge to do something — to have a position on, to be in the market — is strong enough that traders manufacture setups out of noise rather than sit still. The marginal trade is often just the cost of being uncomfortable doing nothing.
FOMO. A move happens without the trader in it, and the regret of having missed it pulls them into the next thing that looks like it might run. This is its own mechanism with its own fingerprint, covered in FOMO trading psychology — but it reliably inflates trade count, because every missed move becomes a reason to take the next one.
Overconfidence after wins. A streak of winners produces a felt sense of "I've got this," and the felt sense quietly loosens the criteria. Setups that wouldn't have qualified yesterday qualify today. This is one of the four mechanisms in how emotions affect trading performance, and frequency is exactly where it shows up first.
The recovery urge after losses. A loss creates pressure to make it back, and the fastest-feeling way to make it back is another trade. The math doesn't support this — the loss is realized regardless — but the urgency is real, and it manufactures trades the edge never asked for.
The cost compounds
The reason overtrading is expensive is not that any single marginal trade is a disaster. It is that the costs stack, and they stack faster than the marginal trades can earn their way out.
Two costs compound with every extra trade. The first is transaction cost: commissions, spread, and slippage are charged per trade, so a higher trade count is a larger fixed drag on the account regardless of outcome. The second is negative selection: the marginal trade is, by construction, a worse trade than the average — it is the one the trader reached for past the edge. So the trades being added are not a random sample of the strategy. They are systematically drawn from its weakest tail.
The empirical picture is blunt. Barber and Odean, studying 66,465 household brokerage accounts over 1991–1996, found that the most active traders earned an annual return of 11.4% while the market returned 17.9% — and the gap was driven almost entirely by transaction costs from excessive trading [1]. Their conclusion gave the paper its title: trading is hazardous to your wealth. In a companion analysis, Odean showed that the stocks individual investors bought subsequently underperformed the stocks they sold — direct evidence that the marginal trade is negatively selected, not merely costly to execute [2].
The pattern is not random across traders, either. Barber and Odean later showed that the traders who churned hardest were the most overconfident ones — and that overconfidence, not skill, predicted who would trade themselves into underperformance [3]. The more you trade past your edge, the more both costs eat the return, and the deeper into the weak tail each extra trade reaches.
The fingerprint in your trade log
Overtrading has a fingerprint, and it is one of the most legible ones in a trade log because it lives in the timestamps. The signal is the relationship between how many trades you take in a day or session and how those trades actually perform.
Bin your trades by trades-per-day. On low-count days, your win rate or expectancy sits at your baseline — these are the days you took only the trades your edge supported. As the count climbs, the marginal trades enter the sample, and because they are negatively selected, the per-trade outcome drops. Your best trades are not in the high-count buckets. Your reaches are.
The diagnostic is the shape: a metric that holds flat across low-count days and then bends downward once the count crosses some threshold. That threshold — the point past which your trades stop earning their baseline — is the number worth knowing.
Notice what this figure does not require. There is no qualitative tag, no "I was bored" note, no memory of how the day felt. The trade count and the outcome are both already in the log. The bend is visible from the numbers alone, which is exactly why it is detectable.
Three structural fixes
These work for the same reason the revenge-trading fixes work: they do not ask the in-the-moment trader to be disciplined. They ask the pre-market trader to set up constraints the in-the-moment trader will run into.
- A daily trade quotaDecide before the open how many trades the day gets, and stop when you hit it. The number comes from your own data — roughly the count at which your buckets start bending down. A quota is binary: either you have trades left or you don't. There is no judgment call to make at the moment your judgment is most likely to manufacture one more setup.
- A pre-defined setup listWrite down the specific setups your edge actually covers. Only trades on the list count. The marginal trade fails this test by definition — it is the one that wasn't on the list this morning. The list moves the decision out of the moment, where the criteria quietly loosen, and back to the desk, where they hold. Sizing each listed setup in advance with a position size calculator keeps the reach trade from also being an oversized one.
- An "is this my edge?" gateBefore any entry, one question: is this a trade I would take on a fresh day, with no streak behind me and no loss to make back? If the honest answer is no, it is a marginal trade and the edge does not support it. The gate is most useful precisely when it is hardest to pass — after a run of wins, or minutes after a loss, when the criteria are under the most pressure to bend.
The measurement layer
Knowing overtrading is costly is not the same as knowing whether you do it, or where your own threshold sits. The Barber and Odean findings are aggregate; they tell you the most active cohort underperforms, but they cannot tell an individual trader which cohort they are in or where their personal line is. Self-narrative is a poor guide here — "I only take good setups" is exactly what the trader reaching past the edge believes.
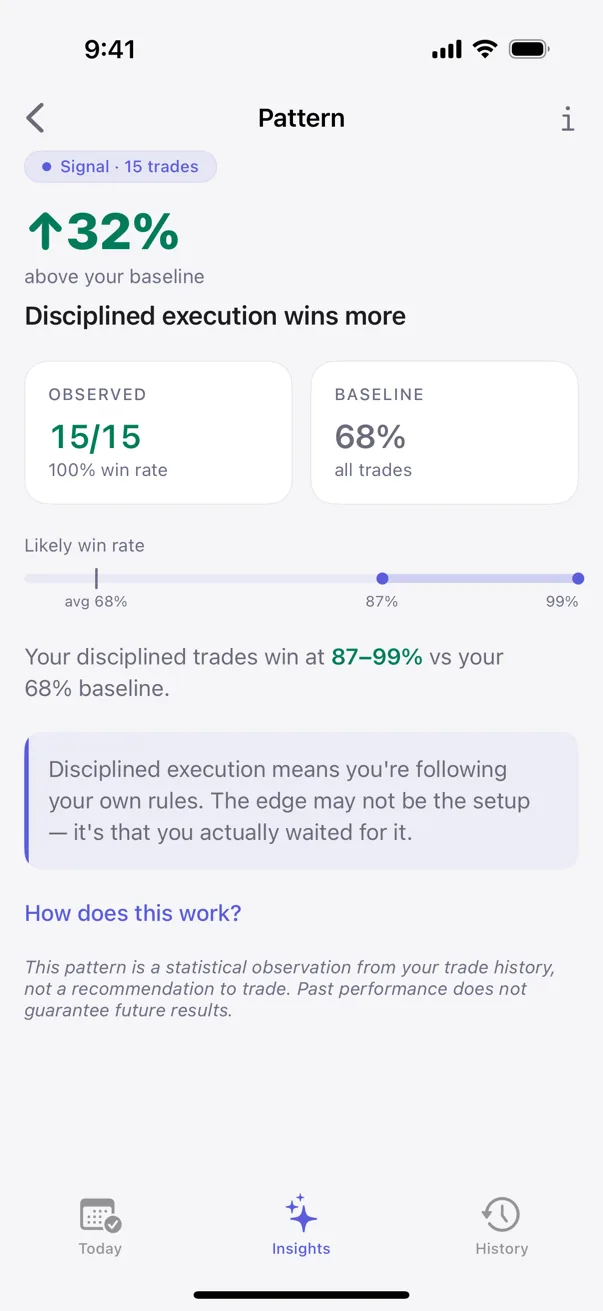
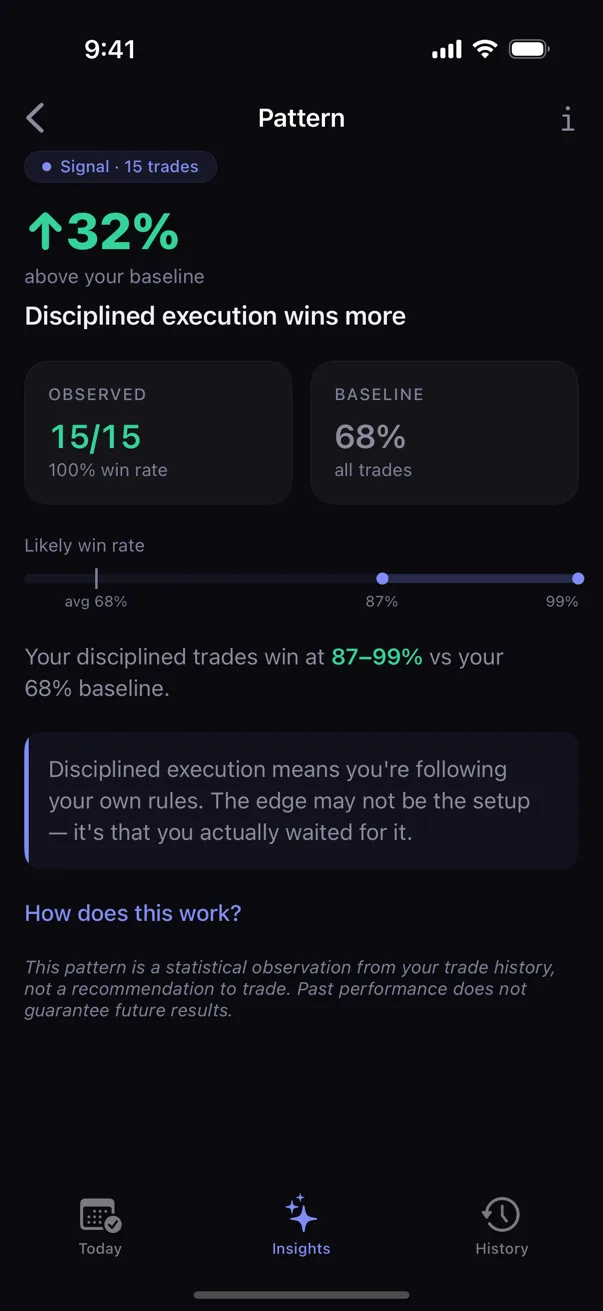
Behavioral pattern detection closes that gap by binning your own outcomes by trade frequency and testing whether the trades past a threshold returned less than your baseline. The output is not a warning ("you might be overtrading"). It is a measurement: your trades past #N per day returned X% less than baseline. The engine compares results on your high-volume days against your low-volume days and surfaces the threshold and the size of the gap — a number pulled from your own money, which is harder to argue with than a generic caution.
Kyra Trading is a private trading journal that does this detection on-device. It uses Bayesian inference and Fisher's exact test to separate a real frequency effect from noise, and every pattern surface carries its sample size and a confidence range, so the trader can see how strong the signal is — patterns move through Tracking, Hint, Signal, and Proven tiers as the evidence accumulates. Nothing leaves the device. Pattern detection runs locally, no accounts, no servers. The trader's data stays the trader's data.
Sources
- Barber, B. M., & Odean, T. (2000). Trading Is Hazardous to Your Wealth: The Common Stock Investment Performance of Individual Investors. The Journal of Finance, 55(2), 773–806.
- Odean, T. (1999). Do Investors Trade Too Much? American Economic Review, 89(5), 1279–1298.
- Barber, B. M., & Odean, T. (2001). Boys Will Be Boys: Gender, Overconfidence, and Common Stock Investment. The Quarterly Journal of Economics, 116(1), 261–292.
Educational only. Not financial or trading advice. Behavioral patterns described above are observations from the published literature; specific outcomes vary with strategy, market conditions, and individual circumstances.