
Read the observation, then the evidence.
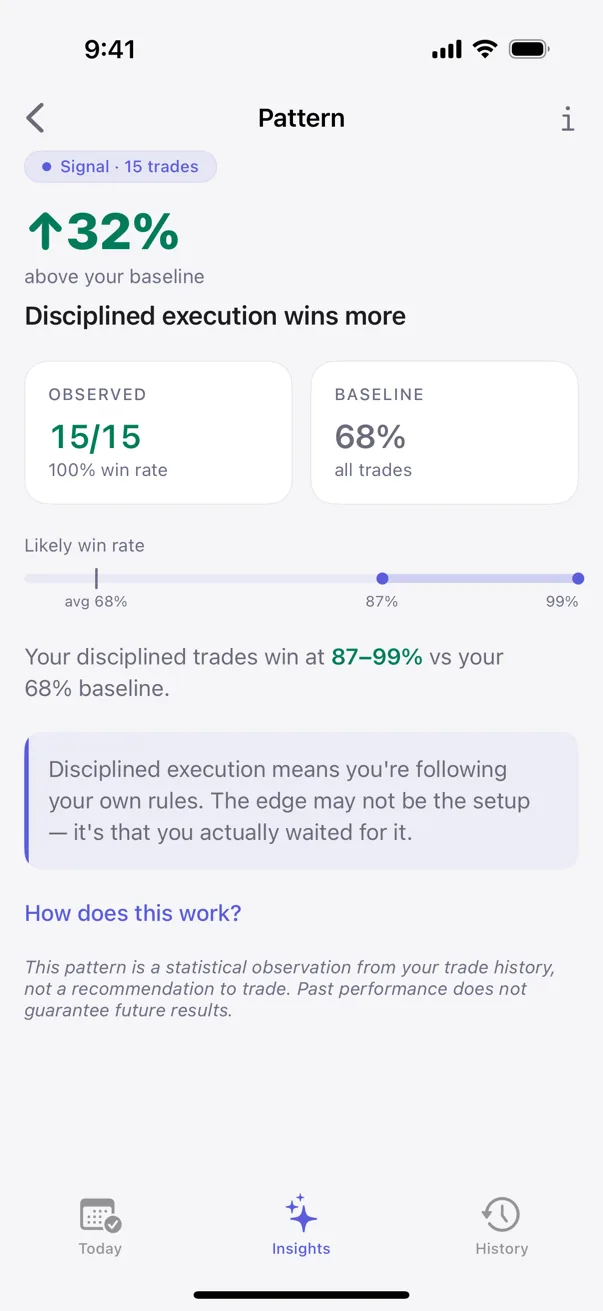
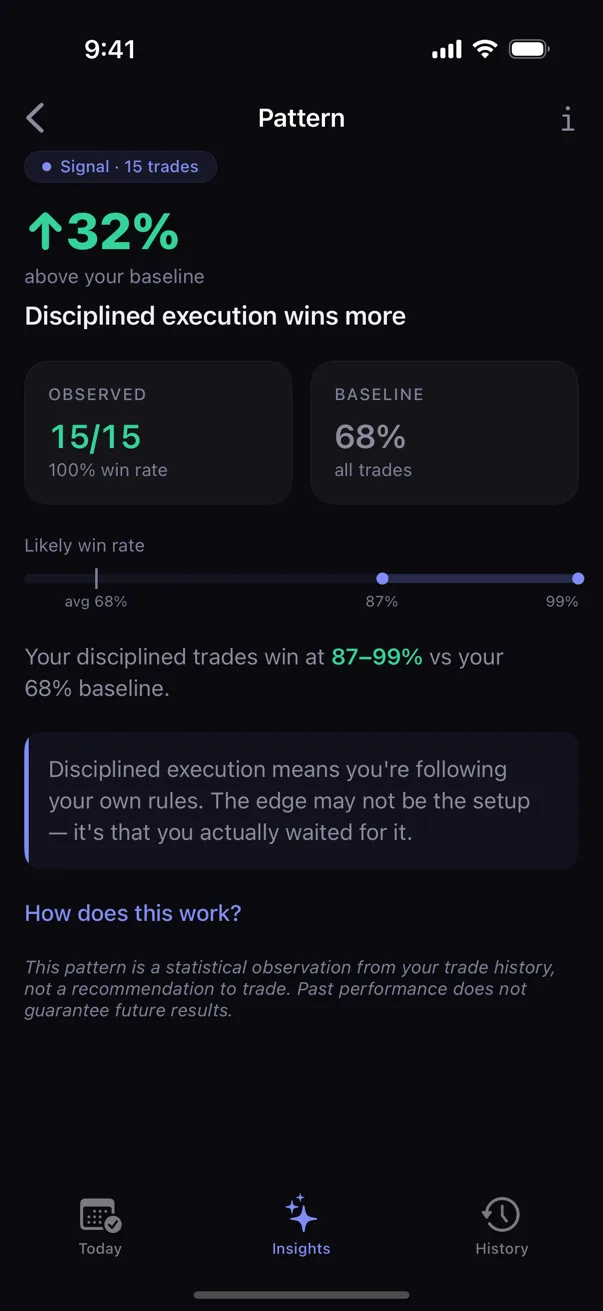
How many relevant logged trades support the comparison.
How much caution the current evidence requires.
A readable label for the strength of the surfaced observation.
The method pipeline
Bayesian inference
Estimates a range that can narrow as evidence grows.
Fisher's exact test
Checks whether an observed comparison could reasonably be noise.
Correction
Accounts for testing many candidate comparisons at once.
Why classical inference fits this problem
A trading-journal user is not running an academic study. The question is operational: given my last few months of trades, what is the engine confident enough to surface, and what is it still calling preliminary?
Four properties make classical statistical inference the right tool for that question:
- It knows when it doesn't know. An uncertainty range widens automatically when sample size is small and narrows as evidence accumulates. The math itself surfaces the uncertainty.
- It quantifies confidence in real numbers, not vibes. Every claim the engine surfaces is auditable end-to-end. Sample size is visible. Uncertainty range is visible. Nothing is hand-waved.
- It is reproducible. The same trade history processed through the same engine yields the same conclusion every time. Reproducibility is structural, not aspirational.
- It fits your data specifically. The math is calibrated to your trade history alone — not to the average internet trader's. Your patterns reflect your behavior, your uncertainty ranges describe your edge.
These are the four properties LLM-based pattern claims structurally lack. An LLM can describe each of them in plausible sentences; it cannot operate the inferential math against a specific trade history with sample-size honesty. The product is the math, not the description of the math.
How Bayesian pattern detection works
The intuition, in one paragraph: the engine starts with no preconception about, say, your win rate on trades you tag as focused — anything between 0% and 100% is on the table. Each new focused trade you log narrows the range a little. After a handful, the range is still wide. After many, it's tight. What you see on a pattern card is whatever range the engine has earned given your data so far. Not a single point estimate. A range.
The label on the card reflects how narrow the range has become. Preliminary patterns carry wide ranges and an honest "early observation" label. As the sample grows, the range narrows, and the label firms up. Nothing about the math is hidden from the trader.
Fisher's exact test and what it gates
Confidence ranges tell you how sure to be of a single rate. Fisher's exact test answers a different question: are two rates actually different, or are you fooling yourself?
Example. Your win rate on planned setups looks higher than your win rate on impulse trades. Is the gap real, or could the difference be random noise on small samples?
Fisher's exact test computes the probability that a gap this big would appear if the underlying rates were actually equal. A small probability means "this gap is unlikely to be noise." A large probability means "this gap could easily be noise; do not act on it yet."
Kyra runs Fisher's exact test on every cross-tab comparison the engine surfaces. The user does not see the p-value (it is not user vocabulary). The user sees: pattern surfaced as confident versus suppressed as still-uncertain. The test is the gating mechanism that prevents premature claims.
Multiple-comparisons correction
If you run many independent comparisons at once, you expect some apparent patterns purely by chance — even when nothing is actually going on. A pattern engine that runs many comparisons faces this problem at scale.
Kyra applies multiple-comparisons correction before promoting any pattern to a higher-confidence label. The price is that the engine surfaces fewer patterns than a naive run would; the benefit is that the surfaced patterns are mostly real.
This is the math behind why Kyra is sometimes "quieter" than competing journals. A noisier engine that surfaces every comparison without correction looks more useful in a screenshot. It is less useful in your trading.
Why we name the math by its real name
Most apps in this category use either generic "AI" language or proprietary brand names for their engine ("AlphaAnalyzer," "TradeGenius," etc.). Kyra does the opposite. The methods are named: Bayesian inference. Fisher's exact test. Multiple-comparisons correction.
Two reasons.
First, the methods are well-understood. Naming them is a contract: anyone with a statistics background can audit whether Kyra is doing what it claims. Hiding methods behind a brand name is an option only for engines that don't want to be audited.
Second, the methods bound what Kyra can claim. A pattern surfaced as confident means a specific thing under classical inference: the uncertainty range has narrowed and the difference has passed a statistical test. The label is not marketing; it is a statistical commitment.
Why this matters for the trade you're about to take
A trading-journal user needs to know whether an observation is supported by a meaningful history or still rests on sparse data. A narrow range can communicate stronger evidence; a wide range can communicate that more history is needed before interpreting the observation heavily.
The methods on this page have been the standard in clinical trials, A/B testing, and behavioral economics for decades. They are exceptionally well-suited to trade journaling: sample sizes are small, decisions are operational, and honesty about uncertainty is the entire value proposition. Inference is what Kyra is for, and the math that fits the problem is the math the engine uses.
If statistical rigor with explicit sample sizes is what you wanted from a journal, that is the reason Kyra exists.