See the evidence behind a pattern.
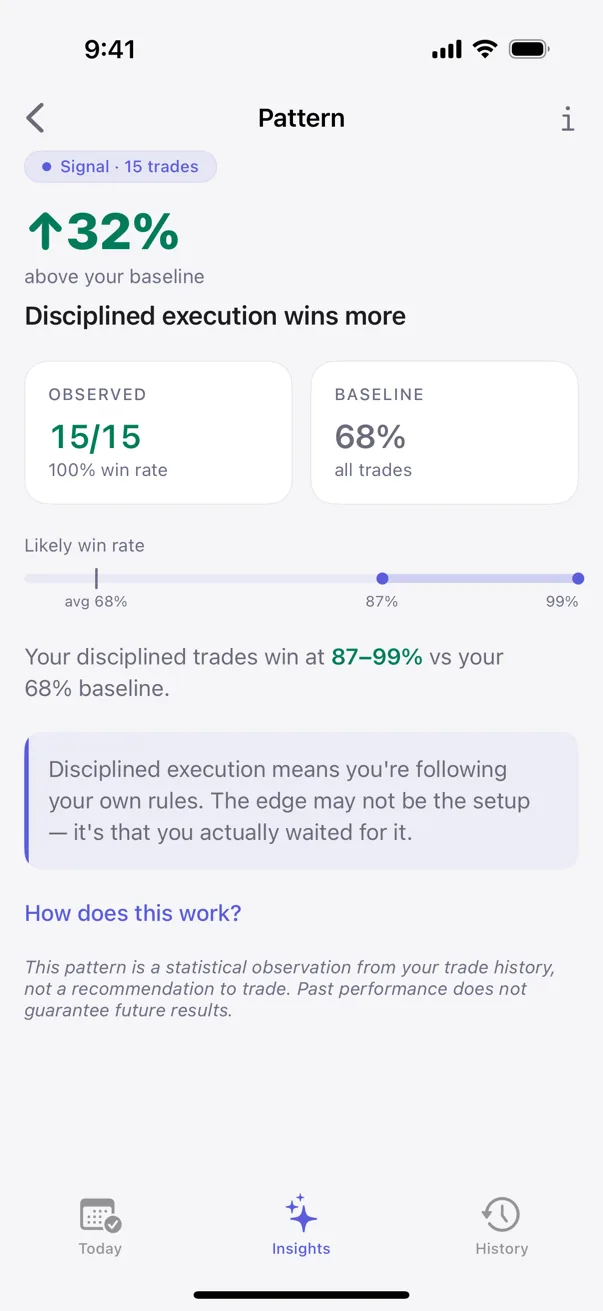
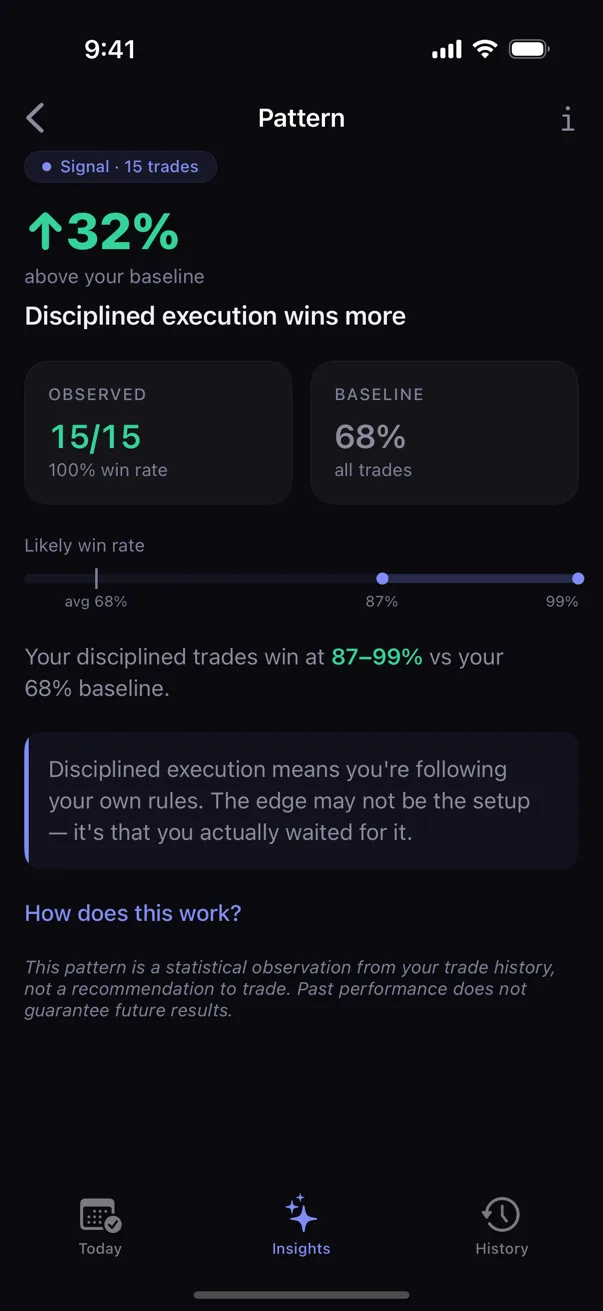
Every surfaced pattern includes its sample size and uncertainty. The detail screen shows what was observed and how it compares with your baseline.

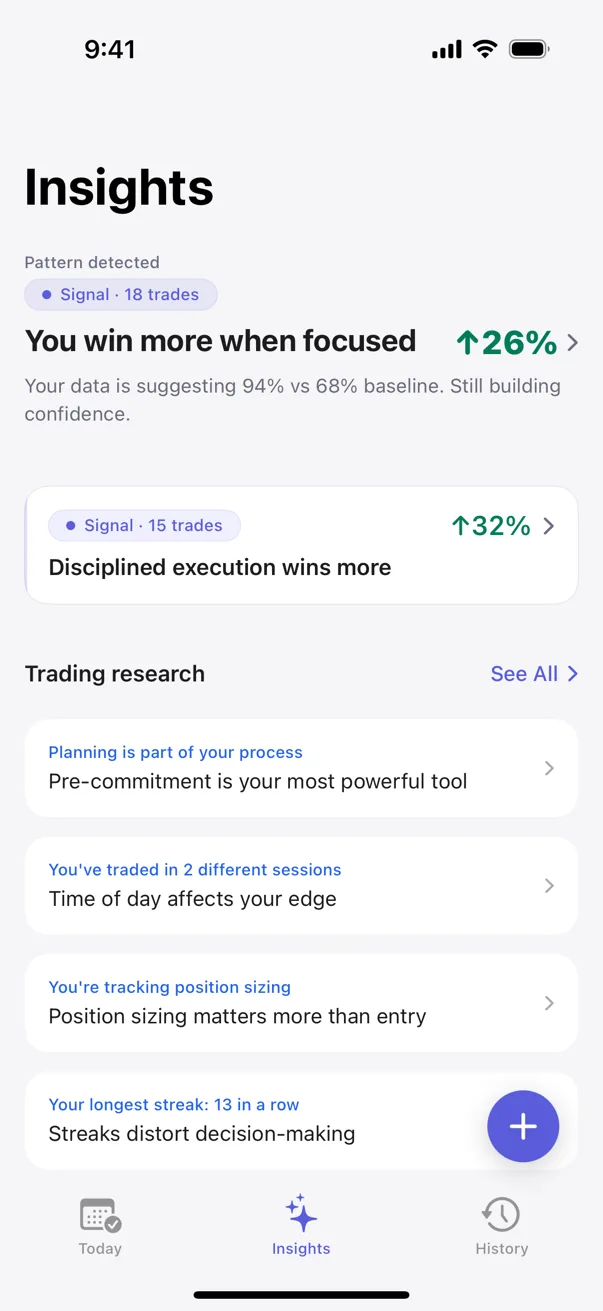
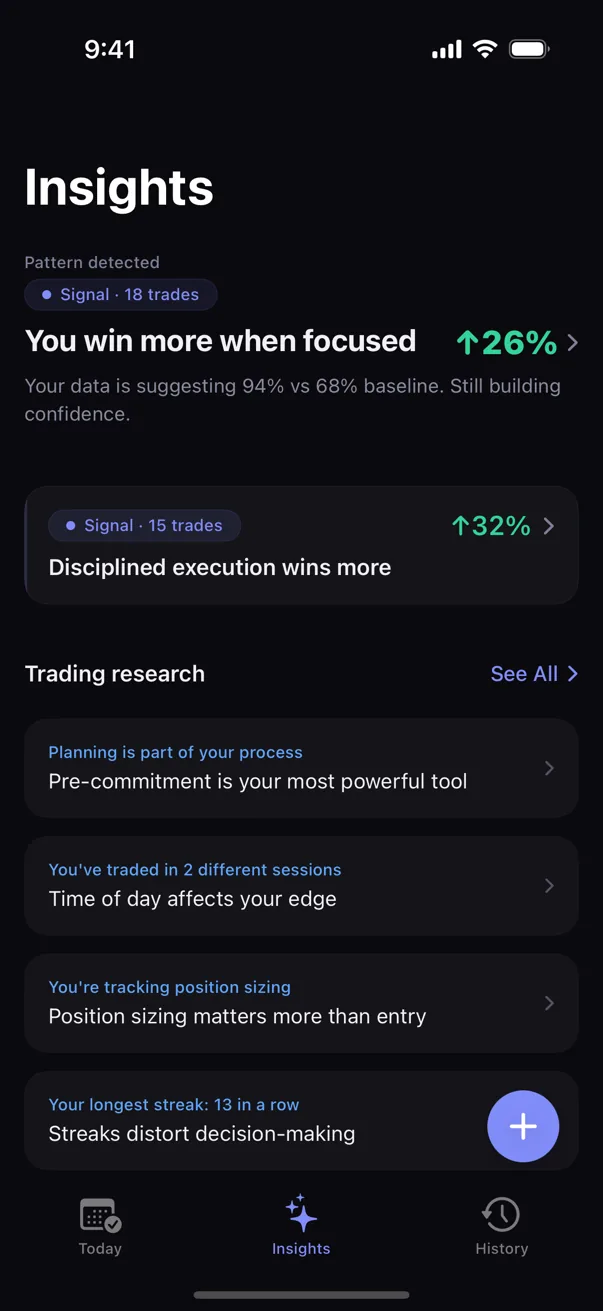
How confidence grows with data
Labels communicate how much evidence exists behind an observation. The range narrows as relevant history grows.
What the engine cross-tabs
Kyra compares recorded context against P&L: emotion, setup, timing, and execution. It surfaces a slice only when enough evidence supports an observation distinct from your baseline.
Concrete examples of the kinds of slices the engine can surface: exit asymmetry (winners cut short, losers held past plan), position-size drift after wins, your own time-of-day performance curve, and stops moved or removed mid-trade. Each is a behavior, not a chart pattern; each leaves a measurable fingerprint in your own log.
What is shown
A plain-language observation, sample size, uncertainty range, and confidence tier.
What is never claimed
A prediction, a trade recommendation, or a guarantee that a past relationship will persist.
How the math works
Kyra uses classical statistical inference: Bayesian inference, Fisher's exact test, and multiple-comparisons correction. These methods fit small personal histories and run on-device without a network call.
- Bayesian inference expresses uncertainty as a range that narrows with evidence.
- Fisher's exact test checks whether two observed rates may differ rather than reflecting noise.
- Multiple-comparisons correction prevents many tested slices from producing careless claims.
For the deeper method description, see The math behind Kyra.
Why not just a dashboard
A dashboard can present attractive averages without showing whether a small sample is reliable. Kyra surfaces fewer observations and keeps sample size and uncertainty attached to each one.
What Kyra never claims
Kyra does not predict a future outcome, grade a setup, or tell you what to trade. It observes your logged history. The trader decides what comes next.
For the bibliography of behavioral finance research the engine draws from, see Research. For why the engine runs on-device instead of in the cloud, see Why on-device.