What over-leveraging actually is
Over-leveraging is a single trade sized past your plan. Your strategy named a position size for this setup. The chart did not change, the risk on the trade did not change, but the number of shares or contracts went up anyway. Whatever pushed it up was not the setup. It was you, reaching.
It is easy to confuse this with overtrading, and the two are different problems with different fingerprints. Overtrading is a frequency problem: too many trades, the marginal one taken past the edge. Over-leveraging is a size problem: one trade that is too big. A trader can take exactly the right trades, on exactly the right setups, at exactly the right times, and still blow up — because the size on a few of them was wrong. Count discipline and size discipline are separate skills, and a trader can have one without the other.
The clean test is the size delta. Hold the setup fixed and ask: is this position larger than the size my plan assigns to a trade like this? If yes, the extra size has to justify itself on the setup's terms, not on how the last trade went. Most of the time it cannot.
The size the setup gets
Position fixed by the rule that was written before the session, scaled to the trade's risk and the account. The last result gets no vote.
The size the streak takes
Position inflated because the last few trades won and it feels like the right one to press. Same chart, same risk per share — a different reason for the size.
Why it happens — overconfidence after wins
The reach is not random. It clusters after wins, and the behavioral finance literature has mapped why for decades. The driver is overconfidence, and it has a clean theoretical model: when traders overestimate the precision of their own judgment, they take on more risk than the information justifies. Odean formalized this — in a market where traders believe they are better-informed than they are, the overconfident ones trade more aggressively and earn less for it [1]. A win streak is exactly the input that inflates that self-assessment. Three winners in a row feel like evidence of skill, and the felt skill quietly raises the risk appetite. Position size is where the raised appetite lands first.
The cost is not theoretical. Barber and Odean took the overconfidence model to real brokerage accounts and found that the traders who acted most overconfidently took on more risk and underperformed for it — overconfidence, not skill, predicted who would trade themselves into worse returns [2]. Sizing up after a run of wins is the same mechanism playing out one trade at a time: the streak reads as proof, the proof loosens the size rule, and the loosened rule meets the same market everyone else faces.
There is a second driver, pointed the opposite way. Loss aversion can size a trade up too, not to press a win but to win a loss back. Prospect theory established that losses feel roughly twice as heavy as equivalent gains feel good [3], and that asymmetry creates pressure to make the loss disappear in one move. The fastest-feeling way to erase a loss is a bigger next trade. The math does not support it — the loss is realized regardless of what the next trade does — but the urge to size up and end the pain in one shot is real, and it is the mirror image of the post-win reach.
The cost is asymmetric
Sizing past plan would be survivable if the upside and downside were symmetric. They are not. One oversized loss can undo many disciplined wins, because the loss is sized larger than the wins that have to repay it — and the repayment is multiplicative, not additive.
The arithmetic is unforgiving the deeper it goes. A 10% account drawdown requires roughly 11.1% to get back to even; 25% requires 33%; 50% requires a 100% gain. The recovery percentage always exceeds the loss percentage, and the gap widens the larger the loss — which is the full drawdown recovery math. An oversized trade is the fastest way to push a routine loss into the part of that curve where recovery stops being realistic. A trader who keeps every trade at plan size takes losses that the next handful of wins can repay. A trader who triples size on the trade that happens to lose takes a loss that may need a winning streak to undo — and streaks are not on demand.
Notice that the bars do not claim a bigger position is mechanically a worse bet on a fair coin. They reflect something behavioral: the trades a trader sizes up are not a random sample. They are the ones taken under the most confidence or the most pressure, which is exactly when judgment is least reliable. The size and the state travel together.
The fingerprint in your trade log
Over-leveraging has a fingerprint, and it lives in the size column rather than the timestamps. The signal is position size drifting above the plan, and the drift is not evenly spread across the log — it clusters.
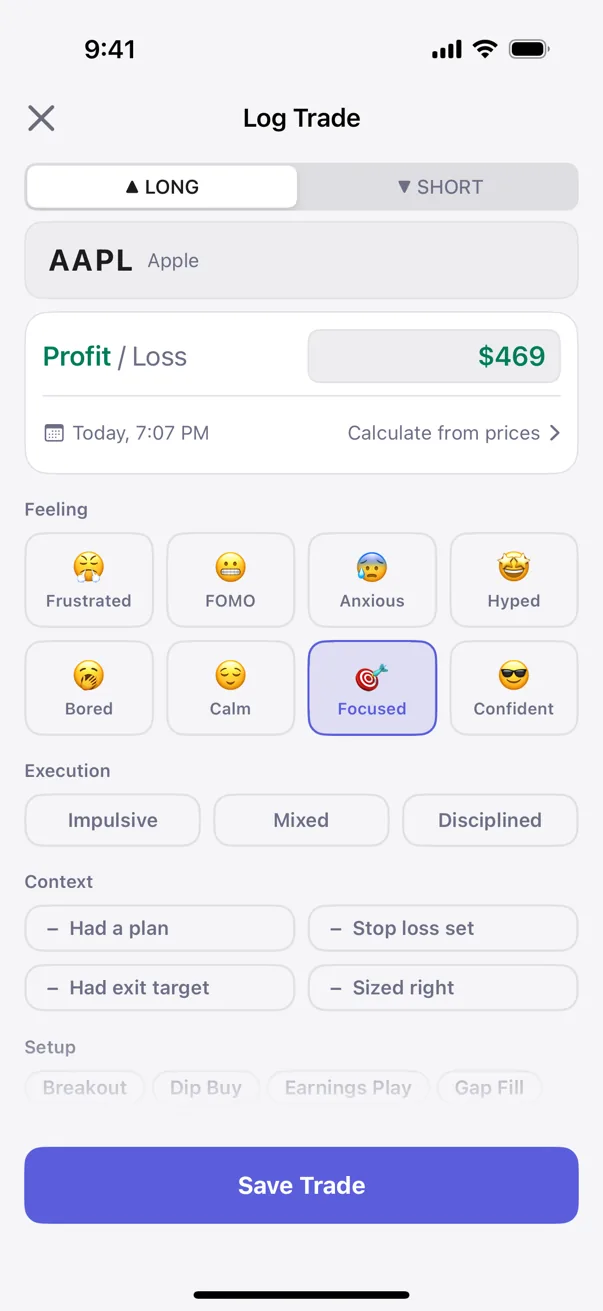
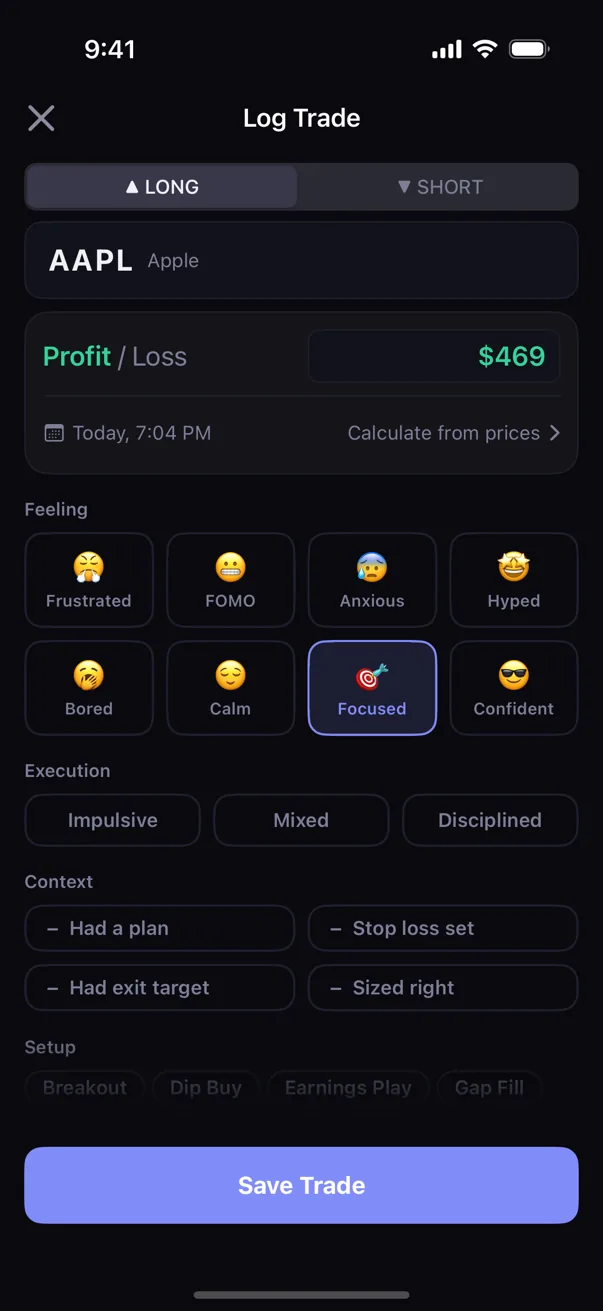
Sort the log and the shape appears. The oversized trades sit right after winning streaks: a run of green, then a position noticeably larger than the trader's own baseline. Often they carry an emotional tell — a Confident or Hyped tag attached to the same entries, because the felt state and the inflated size are the same event recorded twice. The trader does not need to remember the trade to find it. The size sits above baseline, the prior trades are wins, and frequently the tag is right there confirming the state.
The diagnostic is the pairing: larger-than-usual size, immediately downstream of wins, often with a high-arousal emotion attached. That cluster is structurally identifiable from the log alone, which is exactly what makes it detectable rather than merely confessable.
How to cap it
These work for the same reason the overtrading and revenge-trading fixes work: they do not ask the in-the-moment trader to be disciplined after three wins. They ask the pre-market trader to set a ceiling the in-the-moment trader will run into.
1. A pre-set maximum size per trade
Before the session, decide the largest position any single trade is allowed to carry, and treat it as a hard ceiling rather than a suggestion. The number is set when you can think clearly and enforced when you cannot. A maximum is binary in the moment that matters: the trade is either at or under the cap, or it is over. There is no judgment call to make at the exact point — mid-streak, mid-confidence — where your judgment is most likely to wave a bigger position through.
2. Size from the setup, with a calculator
Let the position size come from the trade's risk and your account, not from a feeling about the streak. A position size calculator turns the size into arithmetic: your account, your risk per trade, the distance to your stop, out comes a number. The calculator's job is to produce a size that does not know or care how the morning went. When the size is computed rather than felt, the streak loses its lever.
3. Size does not change with the last result
One rule, stated plainly: the last trade's outcome gets no vote on the next trade's size. A win does not earn a bigger position. A loss does not earn a "make it back" position. Each trade is sized on its own setup, as if it were the first trade of the day with no streak behind it and no loss to repay. This is the gate that catches both the post-win reach and the post-loss recovery size, because both of them are the previous result trying to set the current size.
The measurement layer
Knowing that over-leveraging is costly is not the same as knowing whether you do it, or where your size drifts. The literature is aggregate — it tells you that overconfident traders take on more risk and pay for it, but it cannot tell an individual trader which trades they sized up or what those trades did. Self-narrative is a poor guide: "I size consistently" is exactly what the trader pressing after a streak believes.
Behavioral pattern detection closes that gap. The engine looks for size-after-wins drift — trades sized above baseline that follow winning streaks — and tests whether that cluster, often paired with a Confident or Hyped state and a larger position, returned less than the trader's baseline. The output is not a warning ("watch your size after wins"). It is a measurement: your oversized post-streak trades returned X% less than baseline, on a sample of N. A number pulled from your own money is harder to argue with than a generic caution.
Kyra Trading is a private trading journal that does this detection on-device. It uses Bayesian inference and Fisher's exact test to separate a real size effect from noise, and every pattern surface carries its sample size and a confidence range, so the trader can see how strong the signal is — patterns move through Tracking, Hint, Signal, and Proven tiers as the evidence accumulates. Nothing leaves the device. Pattern detection runs locally, no accounts, no servers. The trader's data stays the trader's data.
Sources
- Odean, T. (1998). Volume, Volatility, Price, and Profit When All Traders Are Above Average. The Journal of Finance, 53(6), 1887–1934.
- Barber, B. M., & Odean, T. (2001). Boys Will Be Boys: Gender, Overconfidence, and Common Stock Investment. The Quarterly Journal of Economics, 116(1), 261–292.
- Kahneman, D., & Tversky, A. (1979). Prospect Theory: An Analysis of Decision under Risk. Econometrica, 47(2), 263–291.
Educational only. Not financial or trading advice. Behavioral patterns described above are observations from the published literature; specific outcomes vary with strategy, market conditions, and individual circumstances.