It's usually not the strategy
The instinct, after a stretch of losing money, is to go looking for a better strategy. A new indicator, a tighter setup, a different market. Most of the time that search is aimed at the wrong target. The strategies that retail traders run are, on paper, fine — breakouts, pullbacks, mean reversion, momentum all have positive expectancy in the right hands and the right conditions. The edge is rarely the thing that is broken.
What breaks is the execution, and it breaks in the same few ways, over and over. The money does not leave the account in one dramatic decision. It leaks — a little on each of a recurring set of mistakes, every one of them small enough to rationalize in the moment and forget by the next session. A sound strategy run through a leaky execution loses money, and it loses it quietly enough that the trader keeps blaming the strategy.
This is the difference between a strategy edge and a behavioral edge, covered in what is a trading edge: a setup can be profitable on paper and still bleed in practice. This page is about the bleed itself — the specific leaks, ranked by how much they cost, and how to find which one is yours.
The four recurring leaks
Decades of behavioral finance research, much of it built on large samples of real retail brokerage accounts, keeps surfacing the same short list. Four leaks account for most of the gap between a strategy's paper expectancy and a trader's actual results.
Overtrading and the frequency cost
The single most documented leak is simply trading too much. In their landmark study of more than 60,000 households' brokerage records, Barber and Odean [1] found that the most active traders earned an annual return roughly 6.5 percentage points below the market, while buy-and-hold investors tracked it closely. The strategies were not the variable. Frequency was. Every additional trade carries cost and exposes the trader to one more impulsive decision, and those costs compound into a return drag that swamps most edges.
The disposition effect
The second leak is selling winners too early and holding losers too long. Odean [2] measured this directly across thousands of accounts and found traders were significantly more likely to realize a gain than an equivalent loss — the disposition effect. The behavior feels like prudence (lock in the win) and hope (give the loser room), but it systematically cuts the trades that were working and nurses the ones that were not. It is the exact inverse of "let winners run, cut losers short," and it is the default human setting.
Loss aversion and revenge sequences
The third leak is what loss aversion does in the minutes after a loss. A loss feels worse than an equivalent gain feels good, and that asymmetry pushes traders into a recovery trade they would not otherwise take — sized to win the loss back, not to fit the setup. The leak is the sequence, not the single trade. The full mechanism and how to interrupt it is in how to stop revenge trading; for this page it is enough to note it is one of the four, and one of the most expensive when it runs.
Oversizing and overconfidence
The fourth leak is putting on too much size, usually after a run of wins. Overconfidence convinces the trader that the current read is better than their average read, so the position grows just as results are most likely to regress toward the strategy's true average. A single oversized trade can erase the gains of many correctly sized ones, and because the recovery math is multiplicative, a deep hit is disproportionately hard to climb out of. Locking size to a fixed risk before the session — the job of a position size calculator — is what keeps this leak from being account-ending.
Why you can't see them
If these leaks are so well documented, why does a losing trader rarely spot their own? Because the leaks are built to be invisible from the inside.
First, memory is biased toward the wrong trades. You remember the big win and the painful blowup — the dramatic ones. The leaks live in the ordinary trades: the third over-frequent scalp of the afternoon, the winner sold twenty minutes early, the position that was one size too large. None of those are memorable, and none of them feel like the problem at the time. Yet the ordinary trades are the ones that set your results.
Second, the leaks are systematic, not occasional. A leak is not a single bad decision you can recall and resolve to avoid. It is a tendency that fires under a specific condition — after a loss, on a hot streak, in the first restless hour — every time that condition recurs. The cost is the small per-trade drag multiplied across every instance, and a per-trade drag is exactly the kind of thing a human cannot feel.
Third, averages hide in the noise. Any one trade's outcome is dominated by variance, so the signal from a leak only separates from the random scatter once you have a sample. By feel, a costly habit and a run of bad luck are indistinguishable. The difference is only visible in aggregate, and aggregate is precisely what intuition cannot compute.
The aggregate cost
Put the leaks together and the total is large. Barber, Lee, Liu, and Odean [3] studied the entire population of individual traders on the Taiwan Stock Exchange and found that, as a group, their trading lost a meaningful share of returns every year — losses concentrated in the most active accounts and traceable to the same behavioral tendencies, not to bad luck. The headline is not that some traders are unlucky. It is that the typical trader gives back a measurable, recurring slice of return to their own behavior, year after year.
That is the bad news and the useful news at once. If the cost were random, there would be nothing to do about it. Because it is systematic — the same leaks, firing under the same conditions — it is addressable. But only if you can see which leak is doing the damage in your account, because the composite ranking above is not yours. For one trader the bleed is concentrated in revenge entries; for another, in oversizing on a streak; for another, in sheer frequency. The list is shared. The personal ordering is not.
How to find yours
Finding your leak is an act of measurement, not introspection. You cannot reason your way to it, because the same biases that hide the leak also corrupt the memory you would reason from. You have to log the trades and let the data rank the leaks for you — overall outcome is a starting point, but the useful version is conditional: how you do after a loss versus on a fresh entry, on planned setups versus impulsive ones, at your normal size versus oversized. Run a P&L calculator across those buckets and the costly conditions begin to separate from the random ones. That is where a leak stops being a vague worry and becomes a number with a sample size attached.
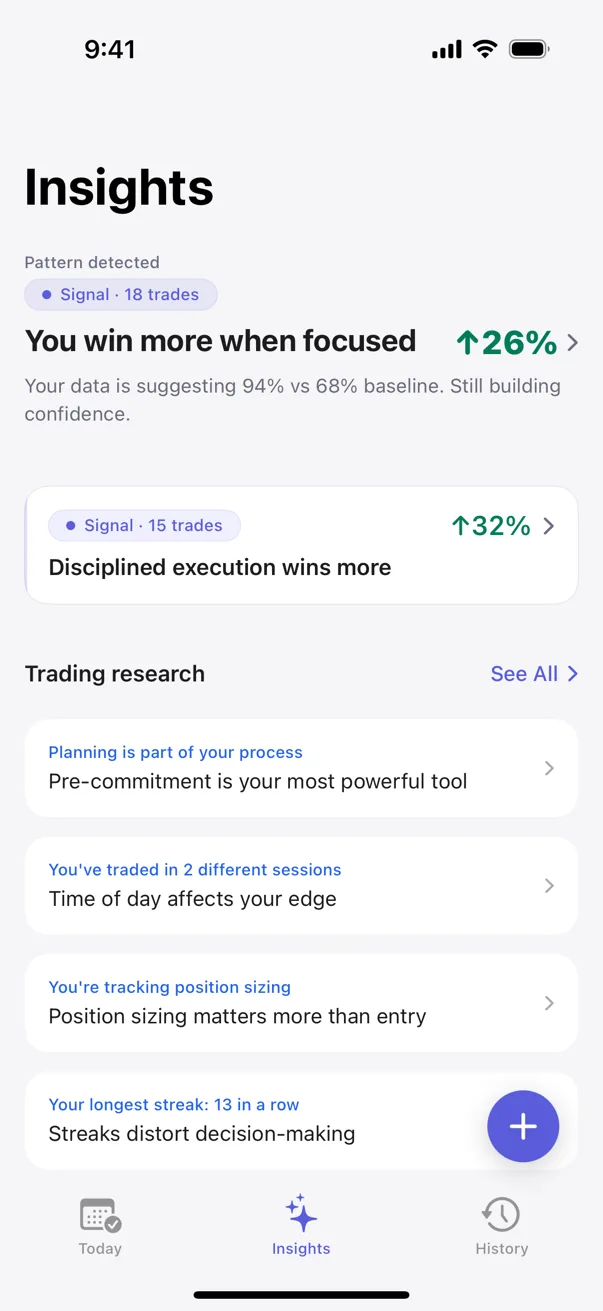
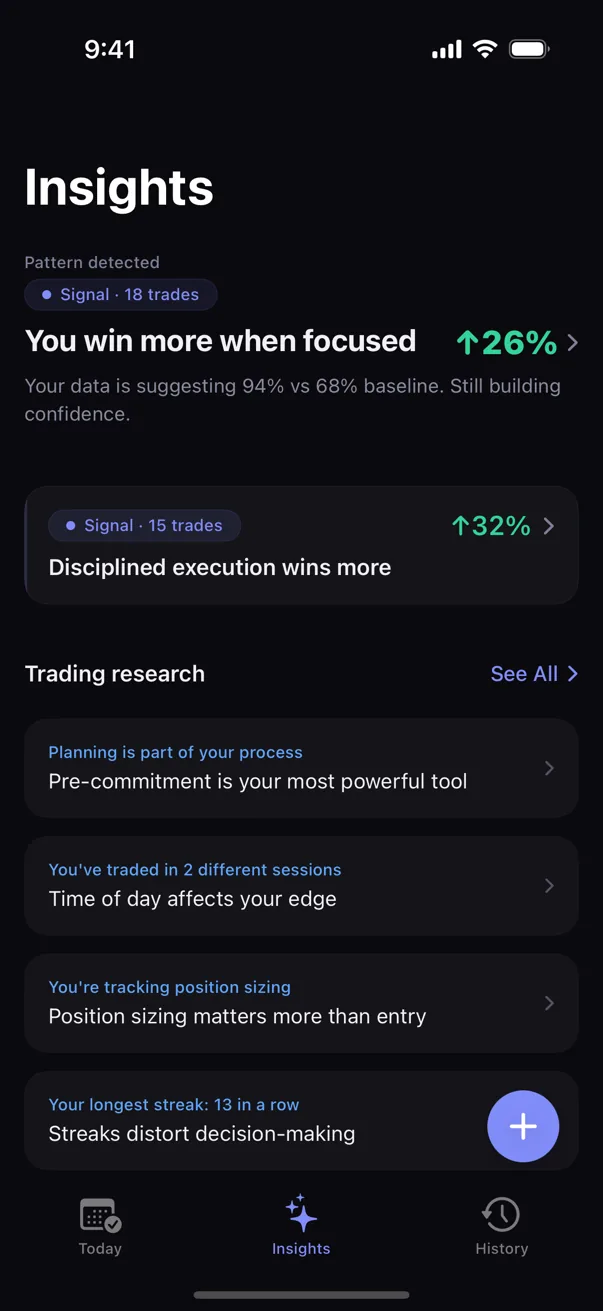
Kyra Trading is a private trading journal for iOS that does exactly this on your own history. Its statistical engine — Bayesian estimation paired with Fisher's exact test — ranks which of your behaviors costs the most, and every pattern surface carries the sample size and a confidence range, graded across four tiers (Tracking, Hint, Signal, Proven) so you can see how much to trust each one before you act on it. The detection runs entirely on the device. No accounts, no servers, nothing leaves your phone — your trade history stays yours. The output is not a warning that revenge trading or overtrading is bad in general. It is the specific, measured statement that one named behavior cost you this much across this many of your own trades, which is the only version of the answer you can actually do something with.
Sources
- Barber, B. M., & Odean, T. (2000). Trading Is Hazardous to Your Wealth: The Common Stock Investment Performance of Individual Investors. The Journal of Finance, 55(2), 773–806.
- Odean, T. (1998). Are Investors Reluctant to Realize Their Losses? The Journal of Finance, 53(5), 1775–1798.
- Barber, B. M., Lee, Y.-T., Liu, Y.-J., & Odean, T. (2009). Just How Much Do Individual Investors Lose by Trading? The Review of Financial Studies, 22(2), 609–632.
Educational only. Not financial or trading advice. Behavioral patterns described above are observations from the published literature; specific outcomes vary with strategy, market conditions, and individual circumstances.