What averaging down actually is
Averaging down is adding to a losing position so that your average entry price falls. Buy 100 shares at $50, watch them drop to $40, buy 100 more, and your average cost is now $45 across 200 shares. The appeal is arithmetic and immediate: the price no longer has to climb all the way back to $50 for the position to break even — it only has to reach $45. You have, in a narrow sense, made the trade easier to win.
That narrow sense is where the trouble lives. Lowering the break-even price is real, but it is only one of two things the add does, and it is the smaller one. The other is that you have increased the size of a position that is currently losing. Your money at risk went from $5,000 to $9,000. A further move against you now costs more per dollar of price than it did before — you enlarged the bet at precisely the moment the market was telling you the original read was wrong.
This is distinct from the disposition effect, which is the passive failure to sell a loser. Averaging down is active: you are not merely holding the losing position, you are committing more capital to it. It is also distinct from anchoring on your entry price, though anchoring is part of the fuel — “it’s cheaper than I paid” is the sentence that makes the add feel like value rather than risk.
“I’m lowering my cost basis”
Frames the add as a discount on a thing you already wanted. The break-even price falls, the position feels rescued, and the second buy reads as discipline — buying value while it’s cheap.
A bigger bet on a failing idea
Dollars at risk rose while the thesis was being disproven. The same adverse move now costs more, and the loss that follows is drawn from a larger position than the one you originally sized.
Why adding to a loser feels smart
The pull toward averaging down is not stupidity — it is a well-documented feature of how people make decisions under loss. Kahneman and Tversky’s prospect theory describes a reflection effect: when choices are framed as gains, people are risk-averse, but when the same choices are framed as losses, people become risk-seeking, preferring a gamble that might erase the loss over a certain smaller loss [1]. A position that is underwater puts you squarely in the loss frame. Taking the certain loss — selling at $40 and booking the $1,000 — is the option prospect theory predicts you will avoid. Doubling down for the chance to get back to even is the gamble it predicts you will reach for.
Sitting underneath that is the sunk-cost fallacy. Arkes and Blumer showed that people’s willingness to commit further resources to a course of action rises with how much they have already invested in it, even when the prior investment is irrecoverable and irrelevant to the decision in front of them [2]. The $1,000 already lost is gone whether you add or not — but it does not feel gone. It feels like a reason to keep going, because walking away would make the loss “real.”
And the behavior tends to escalate. Staw’s classic study of escalating commitment — “knee-deep in the big muddy” — found that decision-makers facing negative feedback on a project they had chosen often responded by increasing their commitment to it, not decreasing it, precisely because backing out would confirm the original decision was wrong [3]. Averaging down once, then again, then a third time as the position keeps falling, is escalating commitment with a ticker symbol. Each add is defended by the adds that came before it.
What it looks like in practice
The danger is that the seductive number and the dangerous number move in opposite directions, so the trade feels safer as it becomes more dangerous. Each add lowers the break-even price — the metric you are watching — while raising the total capital exposed, the metric that determines how bad the outcome can get.
Take the example through one more step. You are now holding 200 shares at an average of $45, and the price slides to $35. Had you never added, your original 100 shares would be down $1,500. Instead you are down $2,000 on 200 shares, and the “it only needs a small bounce” logic invites a third add at $35 to pull the average down again — to roughly $41.70 across 300 shares, with $12,500 now committed. The break-even keeps inching closer while the position quietly grows past any size you would have chosen deliberately at the outset.
This is the structural reason averaging down is dangerous in a way that scaling into a planned level is not. A pre-committed scale-in — sized at entry, with the total position decided before the trade is live — is a sizing method. Averaging down is the same mechanical action taken for a different reason: to rescue a position whose thesis is failing, with capital you had not planned to commit, chosen under the loss frame rather than before it. The action looks identical in a fills log. The intent behind it is the whole difference, and the intent is what determines whether it was risk management or escalation.
The fingerprint in your trade log
Averaging down leaves a clear signature once a log records position size and the sequence of entries. A few signals are worth checking against your own history.
- Multiple entries on losing positions. Do your adds cluster on trades that were already underwater at the time of the add? A position built in stages as price rose toward a target reads very differently from one built in stages as price fell away from your entry.
- Larger average size on losers than winners. If your worst trades carry more shares or contracts than your typical winner, you are likely sizing up on exactly the trades you should be sizing down — the footprint of rescuing losers rather than pressing winners.
- Your biggest losses were added to. Tag the handful of trades that did the most damage. If most of them were positions you averaged down into, the behavior is not occasional — it is where your largest losses come from.
- Adds without a pre-stated plan. The cleanest tell is intent. If the add appears in the record but no scale-in level was set before the trade, it was decided under water — the loss-frame conditions prospect theory describes.
How to counter it
Size the full position at entry
The simplest structural defense removes the room to rescue. If you decide the entire intended position size before the trade is live and take it at entry, there is no held-back capital to deploy when the price falls. Averaging down requires spare ammunition; sizing the full position up front means there is none to reach for in the loss frame. If a setup is only worth a partial position, that is a sizing decision to make calmly at the start, not a door to leave open for a worse moment.
Separate a planned scale-in from a rescue
Adding to a position is not always wrong — adding for the wrong reason is. The distinction is whether the level was committed to before the trade. A scale-in plan written at entry (“add at $46 if it pulls back, total position capped at 200 shares”) is a method, immune to how the loss feels in the moment. An unplanned add at $40 because the position is hurting is a rescue. Decide which one you are doing, and require that any add was named before the trade opened — not invented while it bleeds.
Require a fresh, independent thesis for any add
If you do allow adds, make the bar a new reason to be in the trade, not a lower price on the old one. “It is cheaper than I paid” is anchoring, not analysis. “The level that invalidated my original idea has not broken, and here is independent evidence the setup is still valid” is a thesis. The price being lower than your entry is never, by itself, a reason to buy more — it is the sunk cost talking.
The measurement layer
Catching averaging down means seeing it as a pattern across many trades, not as a single decision you can rationalize one at a time. In the moment, each add has a story. Across the full log, the story is visible as a number: how often you add to losers, how the size of those positions compares to the rest of your book, and how much of your total drawdown traces to trades you averaged into.
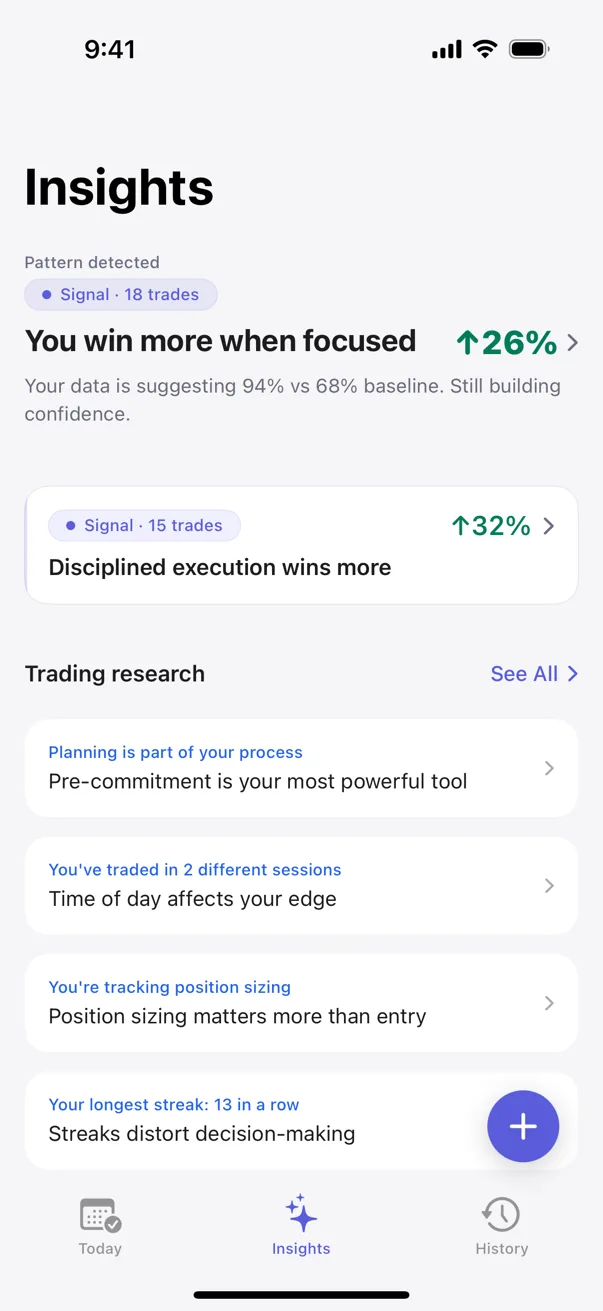
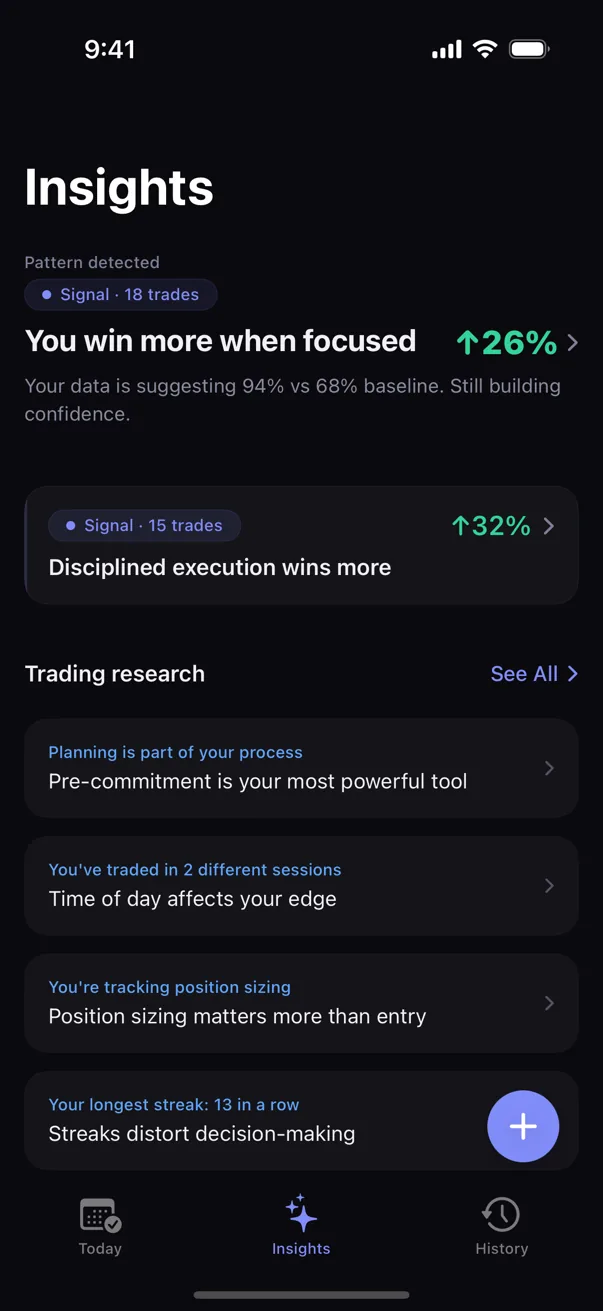
Kyra Trading logs every trade and runs pattern detection across the full history. When a behavior like adding to losing positions recurs, the analysis covers every logged instance, not the most recent one you remember. Pattern surfaces use Bayesian inference and Fisher’s exact test to establish whether a pattern is real or within the noise of a small sample, and the confidence tiers — Tracking, Hint, Signal, Proven — reflect how much evidence sits behind each finding before it is presented as more than a hunch.
The pre-trade checklist captures your intended position size before the trade is live. That gives the log something most journals never have: a record of the size you planned versus the size you ended up holding. When the two diverge — when planned size is consistent but actual size balloons on the trades that went against you — that gap is visible as a number rather than a feeling. Averaging down cannot hide from a record that holds your stated plan next to what you actually did.
Kyra runs all detection on-device. Nothing leaves your phone — no accounts, no servers, no shared data. The full log stays private and the patterns stay yours.
Sources
- Kahneman, D., & Tversky, A. (1979). Prospect Theory: An Analysis of Decision under Risk. Econometrica, 47(2), 263–291.
- Arkes, H. R., & Blumer, C. (1985). The psychology of sunk cost. Organizational Behavior and Human Decision Processes, 35(1), 124–140.
- Staw, B. M. (1976). Knee-deep in the big muddy: A study of escalating commitment to a chosen course of action. Organizational Behavior and Human Performance, 16(1), 27–44.
Educational only. Not financial or trading advice. Behavioral patterns described above are observations from the published literature; specific outcomes vary with strategy, market conditions, and individual circumstances.