What loss aversion is
Loss aversion is not a fear of risk. It is a specific asymmetry in how gains and losses feel: losses are weighted more heavily than equivalent gains when a decision is being made. Kahneman and Tversky named and measured it in their 1979 prospect theory paper [1], which replaced the expected-utility model of economics with one that described how people actually behave. The core finding is that the psychological response to a loss is steeper than the response to a gain of the same size — in their original studies, roughly twice as steep.
The mechanism sits in the shape of the value function. In standard economics, a $500 gain and a $500 loss are mirror images: one adds utility, one subtracts it, by the same amount. Prospect theory replaced the straight line with an S-curve: the gain side rises and flattens (diminishing sensitivity), while the loss side falls faster and also flattens — but from a steeper starting angle. The same dollar amount, but the fall hurts more than the climb feels good.
Symmetric outcomes
A $500 gain and a $500 loss are mirror images — same magnitude, opposite signs. Decisions should be equivalent either way.
Asymmetric responses
Losses feel roughly twice as powerful as gains of the same size. The same trade looks very different depending on which side of zero you currently sit.
Loss aversion is not the same as risk aversion (the general preference for certainty over variance). A risk-averse trader avoids variance. A loss-averse trader responds differently to the same variance depending on whether their current position is red or green. Loss aversion is about the sign, not the magnitude.
Three behaviors it drives in trading
Loss aversion does not produce one behavior. It distorts every decision point where a current or potential loss is visible, which in trading is almost every decision. Three patterns surface consistently in trade logs.
Cutting winners short
A winning trade carries a live unrealized gain. Closing it converts that gain from uncertain to certain — and certainty feels good when loss aversion is running. The pull is toward locking in the green before the position turns, because the imagined reversal registers more powerfully than the imagined additional gain. The result is winners closed before their planned target, runners cut short, and a winning-trade average that is systematically smaller than the losing-trade average — even when the win rate looks acceptable.
Holding losers past the stop
A losing trade carries an unrealized loss. Closing it converts that loss from uncertain to realized, and the realized loss carries the full psychological weight of a loss event. Staying in the trade keeps the position in the domain of “might recover,” which delays the event. Shefrin and Statman documented this pattern as the disposition effect [2]: investors hold their losing positions significantly longer than their winning ones, even when the subsequent performance of the held losers is worse. Stops get moved back, rationales get invented after entry, and the original exit plan quietly ceases to apply.
Passing on valid entries
Loss aversion also operates before a trade opens. Every entry requires tolerating the prospect of a loss, and a loss-averse trader will find reasons not to take it — particularly after a recent loss has made the possibility feel larger. The setup meets every criterion on the plan. The account is down from earlier. The trade does not get taken. The miss looks like discipline from the inside and looks like loss aversion in the log.
What it looks like in your log
Loss aversion produces an asymmetry between how gains and losses are handled at exit. The fingerprint appears in three places.
Exit timing by outcome. When trades are sorted by how long they were held against their planned hold, loss aversion produces a consistent skew: winners close before their intended target, losers stay past their intended stop. The plan was the same for both. What changed was the sign on the P/L.
Average winner vs. average loser size. In a loss-averse log, the average losing trade is larger in dollar terms than the average winning trade — not because the setups were worse, but because winners were exited early and losers were held long. A strategy with a 55% win rate can still lose money if the average loss is twice the average win. Loss aversion manufactures that gap from an otherwise balanced approach.
Trade frequency after drawdown. Loss aversion sometimes produces undertrading rather than overtrading. After a rough session, trade count drops, valid setups are passed, and the account sits flat while the market moves. If your post-loss trade frequency is substantially lower than your baseline, and setup quality in that stretch was not actually lower, that is loss aversion operating as avoidance.
Why knowing this doesn’t fix it
The standard prescription is to hold winners longer and cut losers faster. The advice is correct and largely ineffective as given. The reason is the same as why “just don’t tilt” fails: the impaired decision-maker is the one who needs to make the correction in real time, and the impairment is precisely what makes the correction feel wrong.
Odean’s 1998 analysis of more than 10,000 individual brokerage accounts [3] found that the positions investors held underperformed the positions they sold, on average, in the period after the sale. The investors were not holding losers because they had information suggesting recovery was imminent. They were holding them because closing a loss feels worse than closing a gain. Knowing the mechanism describes the pull. It does not remove it. A trader who has read prospect theory still exits winners early and holds losers long — the understanding is a label on the force, not a lever against it.
Structural defenses
The defenses that work share one property with those that work against tilt: they are set by the calm trader before the position is open, and enforced on the loss-averse trader after it is. The goal is to remove the in-the-moment exit decision from the person most distorted by the outcome.
- Set both exits before entry.A stop and a target, decided when the position is flat and the P/L has no charge. The target matters most: a trader with a stop but no target will close the winner “when it feels right,” which under loss aversion means early. Set the target before entry at the level the setup supports. Treat moving it down as a separate decision requiring a separate argument — not just “I want to protect the gain.”
- Size positions so the stop is executable.A stop that cannot be psychologically executed will be moved. The position size calculator can work in reverse: given a stop distance and a maximum tolerable loss per trade, it returns the position size at which the stop stays holdable. If the setup requires a larger stop than that, the position is too large — not the stop too tight. Loss aversion makes oversized positions ungovernable.
- Log the exit, not just the exit price.After each close, record whether the trade exited at plan (stop or target) or at a different level, and why. The pattern of early winner exits and late loser exits is invisible trade-by-trade and obvious across 20 or 30 trades in a log. Behavioral correction requires seeing the pattern; the pattern requires the record. Without it, the trader who cuts winners consistently will describe themselves as “disciplined about taking profits.”
Measuring your own loss aversion
Loss aversion is not binary — it varies across traders and, for the same trader, across account states and recent outcomes. The question is not whether you have it but whether it is large enough to drive a measurable cost in your data.
Two ratios in your trade log reveal the size of the effect. First, average winning trade size versus average losing trade size: if your losses average larger than your wins across a real sample, exit asymmetry is likely the cause. Second, how often your winners hit their target versus how often your losers hit their stop: a wide gap between these rates — with losers frequently held past plan — is the disposition effect operating in your own account.
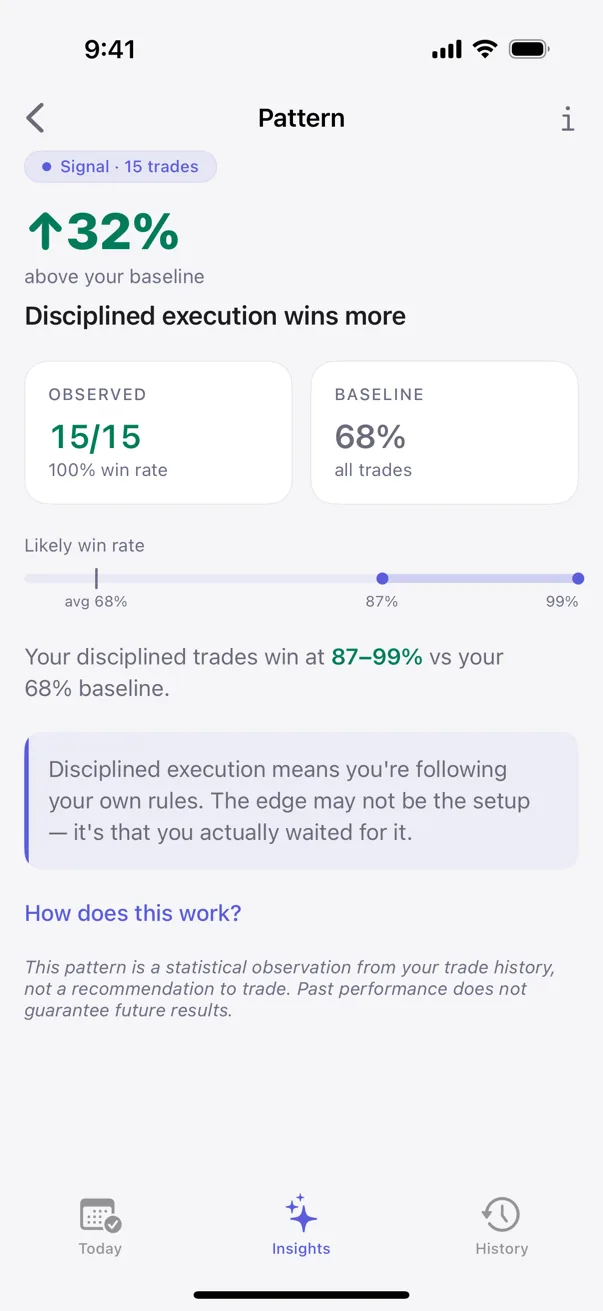
Kyra surfaces the exit asymmetry as a behavioral pattern: it compares exit adherence and exit distance on winning trades against the same measures on losing trades, and flags the gap when the sample is large enough to be credible. Each detected pattern carries a sample size and a confidence tier — Tracking, Hint, Signal, or Proven — so a finding built on eight trades is labeled differently than one built on eighty. Everything runs on-device. Nothing leaves the phone.
Sources
- Kahneman, D., & Tversky, A. (1979). Prospect Theory: An Analysis of Decision under Risk. Econometrica, 47(2), 263–291.
- Shefrin, H., & Statman, M. (1985). The Disposition to Sell Winners Too Early and Ride Losers Too Long: Theory and Evidence. Journal of Finance, 40(3), 777–790.
- Odean, T. (1998). Are Investors Reluctant to Realize Their Losses?Journal of Finance, 53(5), 1775–1798.
Educational only. Not financial or trading advice. Behavioral patterns described above are observations from the published literature; specific outcomes vary with strategy, market conditions, and individual circumstances.