A journal has two layers
Open almost any trading journal — a spreadsheet, a broker export, a notebook — and you will find a faithful record of trades. Instrument, direction, entry, exit, size, profit and loss. It is accurate, it reconciles with the account, and it is mostly inert. You can read a hundred rows of it and learn nothing you can act on, because every column describes an outcome the market produced, not a decision you made.
The fix is not more price data. It is a second layer. A journal that changes how you trade records two different things about each trade: what happened, and why you were in it. The first layer is the trade record. The second is the decision record. They look similar on the page, but they answer opposite questions, and only one of them holds an edge you can adjust.
The trade record
Instrument, direction, entry and exit price, position size, P&L. The facts the broker already knows. They reconcile the account and describe the outcome — but the outcome is mostly what the market decided, so this layer is descriptive, not diagnostic.
The decision record
Emotional state at entry, whether it was a planned setup, whether you followed your rules, the setup type, execution quality. The inputs you actually controlled. This is the layer pattern detection reads, because it is the only one that correlates behavior with results.
The asymmetry is the whole point. The trade record is handed to you; the decision record you have to choose to capture. And the decision record is where every repeatable lesson lives, because it is the only layer made of things you decided rather than things that happened to you.
The trade fields — the necessary minimum
Start with the layer that is not optional. Every journal needs the trade record, because without it nothing reconciles and no analysis has anything to attach to. Keep it lean — these are the fields, and there is little reason to add more:
- Instrument — the ticker or symbol traded.
- Direction — long or short. It changes how every other field reads.
- Entry and exit — the prices you got in and out at.
- Position size — shares, contracts, or lots. The bridge between price and dollars.
- Profit and loss — the realized result, the number the account confirms.
- Date and time — the timestamps. They cost nothing and they unlock cuts by session and hold time later.
That is enough to compute win rate, average win and loss, and the geometry of each trade. It is also where most journals stop. The stopping point is the problem: everything above describes the result, and the result is the part you had the least control over once the trade was on.
The decision fields that actually find patterns
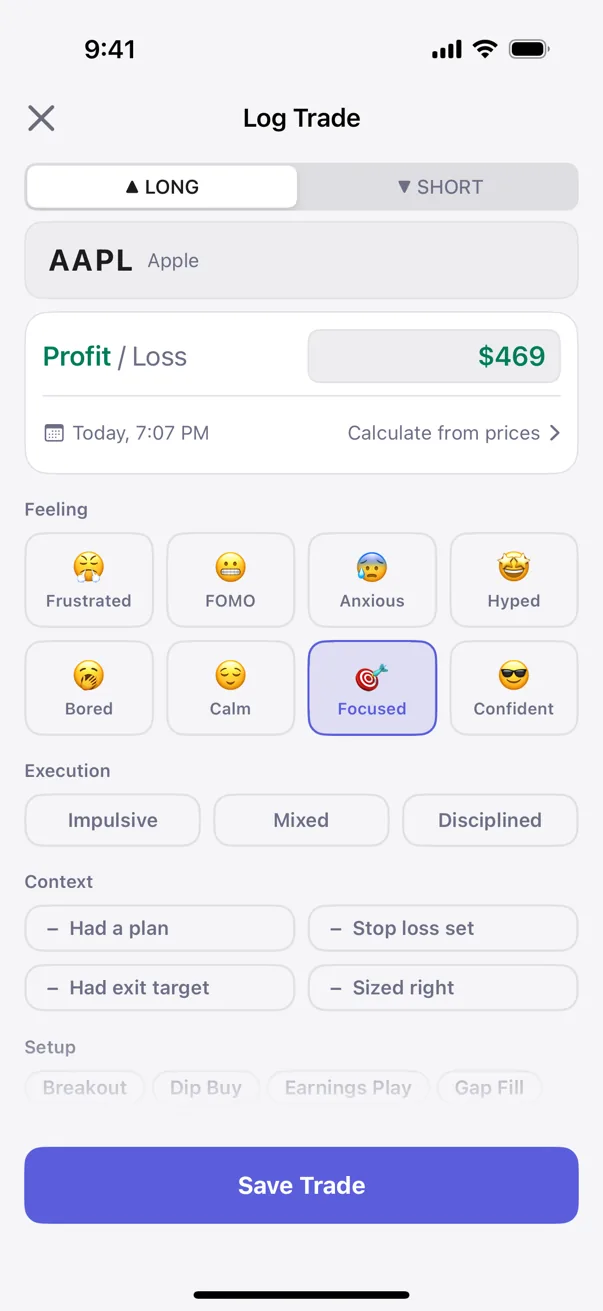
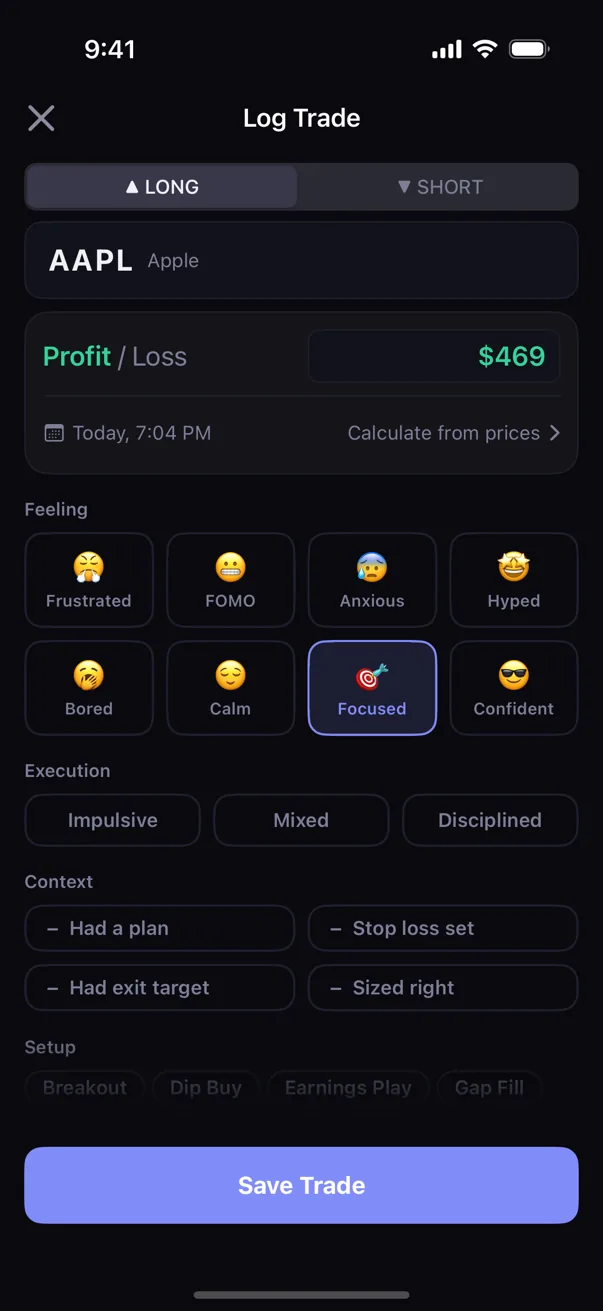
This is the layer that earns the journal its keep. Each of these fields records something you decided or felt, captured at the moment it was true, so that later you can ask whether it correlates with how the trade turned out. Price alone cannot answer that question — it has no column for why you were in the trade. These fields are that column.
Emotional state at entry
One tag for the felt state when you pulled the trigger: calm, focused, FOMO, hyped, anxious, frustrated, confident, impulsive. It takes a second to log and it is the single most diagnostic field in the journal.[2] The trades taken from a clean headspace and the trades taken to chase or to get even tend to separate sharply once you have a few weeks of tags — but only if the tag was recorded at entry, before the outcome could color the memory. Logged after the fact, the emotion column becomes fiction; logged in the moment, it is the closest thing to a confession the data has.
Planned versus impulsive
A binary, asked at entry: was this a setup I had planned, or did I improvise it? Impulsive trades are not automatically losers, which is exactly why they are worth counting — the ones that win are the ones that quietly teach you to keep improvising. Tagging the trade as planned or not is how you find out, weeks later, whether the trades you talked yourself into are paying for themselves or bleeding you.
Rule-adherence
Adjacent to the last, but finer: did you actually follow your own rules on this trade? Sized to plan, stop where it belonged, exit at the target you set — or did the size creep up, the stop get yanked wider, the target abandoned mid-trade? A trade can be a planned setup and still be executed badly. Recording adherence as its own field separates "I took the right trade" from "I took the right trade the right way," and the gap between those two is usually where the avoidable damage sits.
Setup tag
A label for the pattern that triggered the trade: breakout, dip buy, earnings play, gap fill, momentum, reversal, scalp. Grouping a few months of trades by setup is how you learn which one is carrying your results and which one keeps showing up in your losers. Almost every trader has a setup they believe in that is quietly underwater and another, less glamorous one that pays the bills — and the only way to tell them apart is to have tagged each trade with the setup that produced it.
Execution rating
A coarse, honest grade on how well you executed: disciplined, mixed, or impulsive. Three buckets, not a ten-point scale, because precision you cannot honestly assign is just noise. This field is the one that lets a winning trade be marked as poorly executed and a losing trade as well executed — the distinction the scoreboard erases. Over enough trades it answers the question P&L cannot: are your good outcomes coming from good process[1], or from sloppy process the market happened to pay you for?
What ties these five together is that each one is a behavior, and behaviors are what pattern detection can correlate with outcomes. To find a pattern, an engine needs a column for the behavior on one side and the result on the other; then it can test whether the behavior moves the result. The trade record supplies the result. The decision record supplies the behavior. Without the second layer there is nothing to correlate — price against price tells you the market's story, not yours.
Why most journals skip these fields
If the decision fields are where the edge lives, the obvious question is why so few journals carry them. The answer is not that traders do not know they matter. It is that the decision fields are harder to log than the trade fields, in two specific ways.
First, they are subjective. Entry price is a fact; "I was anxious" is a judgment, and judgments feel softer, less worth recording, easier to skip. Second, they are tedious — they have to be captured in the moment, when the trade is live and your attention is on the chart, not afterward when it is convenient. A broker export hands you the trade record for free. Nobody hands you the decision record; you have to stop and write it down at the least convenient time.
So the fields get dropped, and the journal collapses back to a price log. The irony is that the friction is the signal. The fields that are annoying to capture are annoying precisely because they require you to be honest about a decision while you are still inside it — and that honesty, accumulated across a few hundred trades, is the entire raw material of edge analysis. The tedious column is the valuable one.
How much is enough
The risk in the other direction is real too. Faced with the case for behavioral fields, the temptation is to add everything — market regime, news catalyst, sleep, caffeine, a free-text paragraph per trade. Resist it. A journal with fifty fields is a journal you will abandon, and an abandoned journal detects nothing. The goal is the smallest set of fields that map to behaviors you can actually detect and change.
1. Prefer fields that map to a behavior
Keep a field only if you can name the decision it records and the change you would make if it correlated with losses. Emotion maps to "stop trading from that state." Setup maps to "stop taking that setup." A field that does not point at an action you could take is decoration, and decoration is what makes a journal too heavy to maintain.
2. Prefer structured tags over free text
A fixed set of choices — eight emotions, seven setups, three execution grades — is something an engine can group and count. A paragraph of free text is something only you can read, one trade at a time, which means in practice nobody reads it. Structured fields are what let the review become a sort-and-read instead of a re-litigation of every trade.
3. Make sure the numbers still reconcile
The behavioral layer never replaces the trade record; it sits on top of it. Keep the price and size fields clean enough that the dollars tie out — if a leak shows up in the behavioral cuts, you will want to size it in real money. Running a few of the offending trades through the P&L calculator turns "I think the FOMO trades hurt" into a dollar figure, which is the difference between a hunch and a rule worth keeping.
A handful of fields that each map to a detectable behavior beats fifty you never review. The journal you keep is worth more than the exhaustive one you quit.
Measuring it
The fields above are not arbitrary — they are a specification. Kyra captures exactly this set on every trade: emotion at entry, execution rating, a planned-setup flag, the setup tag, and the rule-adherence checks, layered on top of the standard trade record. They are chosen so that the engine can correlate behavior with outcome without you configuring anything. There is no field designer to set up, no taxonomy to invent. You log the trade, tag the decision, and the structure the analysis needs is already there.
What the engine does with those fields is run statistical tests across your own history, looking for behaviors that move your results. Each finding carries a tier — Tracking, Hint, Signal, Proven — that tells you how much weight the evidence can bear so far, so an early, thin pattern is never dressed up as a settled one. Before you turn a finding into a rule, the risk/reward calculator lets you pressure-test the trade geometry behind it. The point of capturing the decision fields was always to make them measurable; this is the part where they get measured.
Kyra Trading is a private trading journal that does this on-device. Pattern detection runs locally using Bayesian inference and Fisher's exact test, and every pattern surface carries its sample size and a confidence range, so you can see exactly how much a signal is worth before you act on it. There are no accounts and no servers — nothing leaves the device. Your trades, and the patterns inside them, stay yours.
Sources
- Steenbarger, B. N. (2015). Trading Psychology 2.0: From Best Practices to Best Processes. Wiley.
- Lo, A. W., Repin, D. V., & Steenbarger, B. N. (2005). Fear and Greed in Financial Markets: A Clinical Study of Day-Traders. American Economic Review, 95(2), 352–359.
Educational only. Not financial or trading advice. The journaling practices described above draw on the published literature on trading process and trader psychology; specific outcomes vary with strategy, market conditions, and individual circumstances.