The short answer
A point estimate describes the history you have; an uncertainty range describes how much that estimate could plausibly vary as the sample grows. A small sample usually produces a wide range. A larger, consistently tagged sample usually narrows it. Neither number predicts the next trade or guarantees a result.
Kyra shows the estimate, the range, and the matching sample size together because separating those three pieces makes a personal pattern easier to read honestly.
The three pieces of a pattern
| Piece | What it says | What it does not say |
|---|---|---|
| Point estimate | The observed rate or difference in the trades you logged. | That the same number will repeat next week. |
| Uncertainty range | How much the estimate may move given the evidence so far. | That every future result must land inside the range. |
| Sample size | How many trades actually match the question being asked. | That a large total journal makes every slice large. |
Why small samples move so much
If 3 of 4 matching trades win, the observed rate is 75%. One more loss changes it to 60%; one more win changes it to 80%. The arithmetic is not exposing a flaw in the journal. It is exposing how much influence each result has when the denominator is small.
At 60 wins out of 80 matching trades, one additional result has much less influence on the percentage. The history is not automatically “true” at 80 trades, but it is less fragile than the four-trade estimate. More evidence narrows uncertainty only when the tags describe a reasonably comparable question.
How to read the range
- Start with the question. “How do my FOMO trades compare with my calm trades?” is more precise than “Am I a good trader?”
- Check the matching count. A pattern based on 7 trades deserves less weight than one based on 70.
- Look at the width. A wide range means the journal has not separated the possibilities yet. Keep logging before making a large process change.
- Compare direction and cost. A difference can be statistically interesting and still be too small to matter to your actual process.
- Re-check later. A personal pattern is a living measurement. New market conditions, a changed setup, or different execution can move it.
How this appears in Kyra
Kyra's Insights cards label a detected pattern with its tier, sample size, baseline comparison, and confidence range. The four released tiers are Tracking, Emerging, Developing, and Established. The tier is a reading aid for how much evidence sits behind the observation, not a prediction about the next trade. The app can surface evidence about your logged behavior, but it cannot turn that evidence into a trade recommendation.
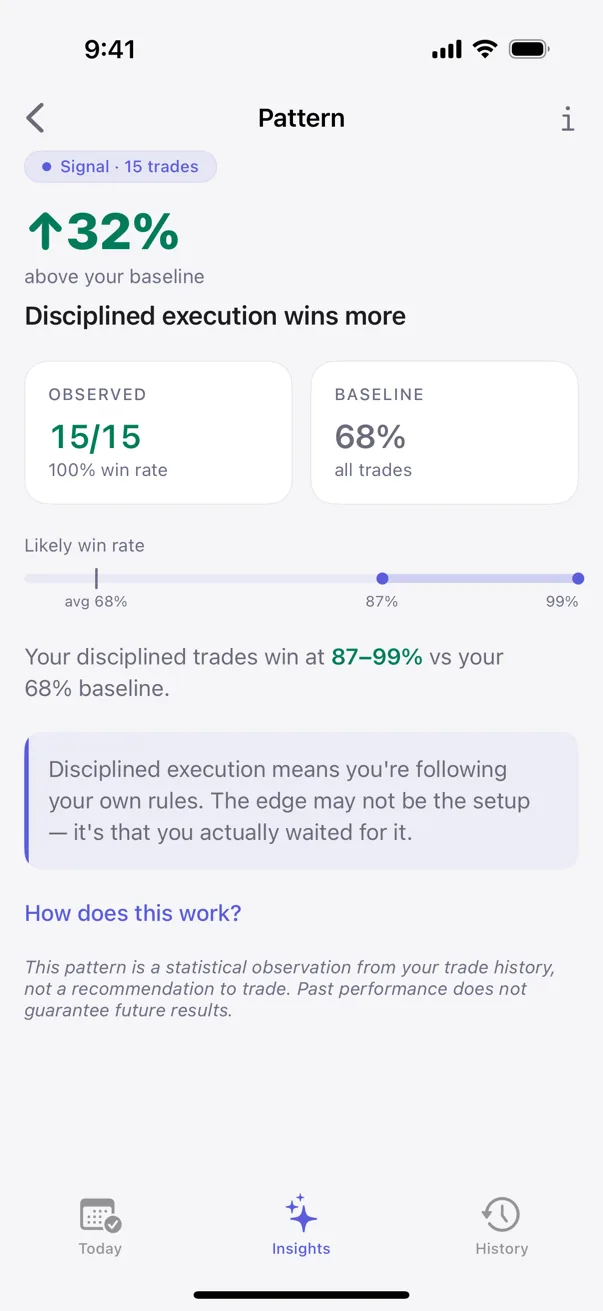
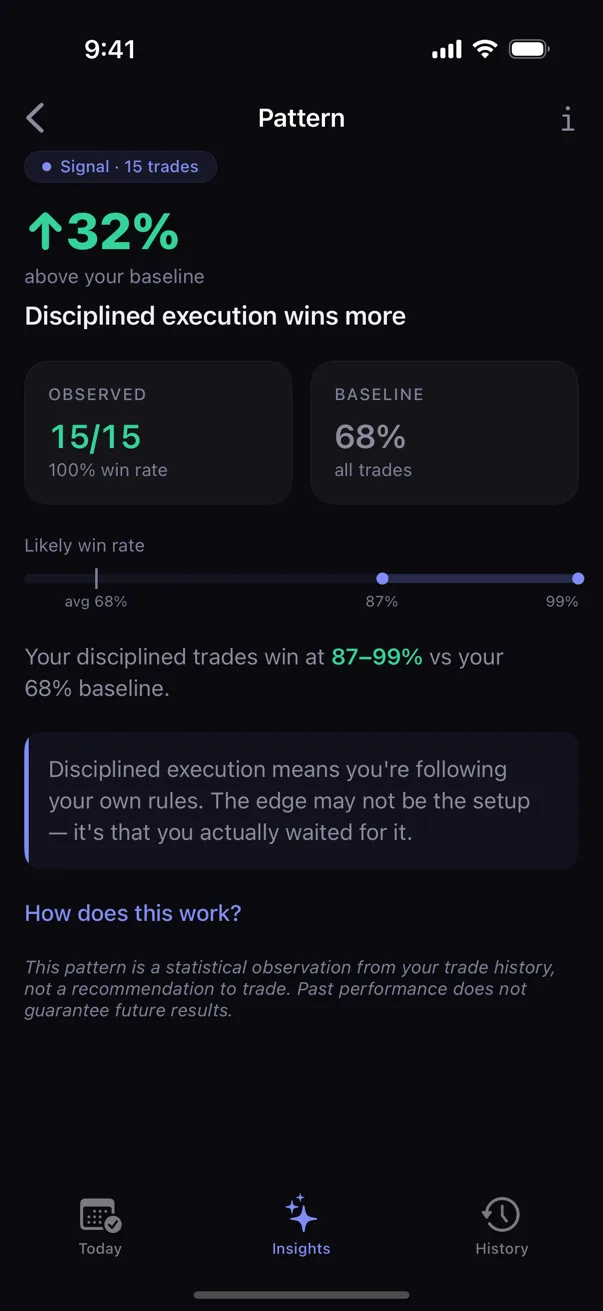
Pattern detection runs on the device. Kyra is an iPhone trading journal for recording completed trades and reviewing your own history, not a broker connection, market signal, or promise of profitability. See how pattern detection works and how many trades patterns need.
A useful weekly question
Instead of asking “Did this pattern work?”, ask: What did the range look like last week, what changed after these new trades, and is the evidence strong enough to justify one small process experiment? That question keeps the journal in its proper role: a feedback loop for decisions you control.
For a repeatable review, use the weekly trade-review guide and the free trading journal template. Both are educational tools, not financial advice.
Educational only. Not financial or trading advice. Statistical summaries describe the recorded history; they do not forecast a particular trade or account outcome.