What recency bias actually is
Recency bias is the tendency to assign more weight to recent events than their actual frequency or importance warrants. When you form a judgment — how likely is my next trade to win, is my strategy still working, how much should I risk this week — the information that comes to mind first and most vividly is the information from the last few days or trades. The full historical record is available in principle, but it does not feel as immediate, and it does not drive behavior the way the recent run does.
The underlying mechanism is the availability heuristic, first described by Tversky and Kahneman in 1973: people estimate probability not by calculating base rates but by assessing how easily relevant examples come to mind [1]. Recent events are more available — easier to retrieve, more vivid, more emotionally charged than older ones. The result is a systematic distortion: the more recent the event, the more heavily it is weighted, regardless of whether that weighting is statistically justified.
In most domains this shortcut is harmless or even adaptive. If it rained yesterday and the week before, bringing an umbrella is reasonable. But financial markets have a structure that makes the shortcut actively dangerous. Markets are noisy. Any short run of trades — even ten or twenty — can deviate substantially from the true long-run expectancy of a strategy. Using a recent run as your evidence base is like judging a coin by the last six flips.
Your last 5–10 trades
Vivid, emotionally weighted, easy to reconstruct in detail. The evidence that actually drives your next sizing decision and setup selection — whether or not it is representative of your true expectancy.
Your full log, 50+ trades
Statistically useful, emotionally flat. The only sample large enough to separate your edge from variance — but it takes deliberate effort to reach for it when the recent run is louder.
Why the recent run feels like the truth
The conviction that your most recent trades reveal something true about you as a trader is not irrational in the abstract. In skill-based activities with fast feedback loops — chess, athletics, music — recent form is genuinely informative. A musician playing badly in rehearsals is probably playing badly. The skill has not changed, but the current form matters and is readable from the sample.
Trading looks like this but is not. A strategy with genuine positive expectancy will still produce losing runs — not because the edge has disappeared, but because variance is part of how markets work. Research on investor return expectations found that individual investors’ forecasts of future returns were heavily predicted by recent past returns, not by fundamental valuations [2]. The same mechanism shapes active traders’ assessment of their own edge: recent results feel like signal even when they are largely noise.
The emotional loading of recent trades amplifies this. A losing streak does not feel like a neutral sample of variance. It feels like evidence of incompetence or a broken system — and it activates loss aversion, which makes the next loss feel more threatening still. The response is to protect: cut size, tighten criteria, take fewer trades. Sometimes that is the right move. Often it is recency bias wearing the costume of risk management.
What it looks like in practice
Recency bias in trading tends to show up as two mirrored failure modes, one in each direction of a streak.
After a losing run, traders abandon working setups, reduce size to levels that cannot produce meaningful returns, and sometimes exit strategies that had positive expectancy over a longer sample. The impulse feels prudent — “I need to reassess” — but the reassessment is driven by a sample too small to support its conclusions. A strategy that showed a real edge over 80 trades can look broken over the most recent 8. Abandoning it at the bottom of the variance trough is one of the most common ways traders give up an edge they actually had.
After a winning streak, the mirror image applies. Confidence rises, size grows, criteria loosen. Trades that would not have passed the normal screen start to pass because the recent wins make the setup feel safer. Ten winning trades in a row is consistent with both a genuine edge and a lucky run on a low-expectancy strategy. Treating it as confirmation of skill inflates risk at exactly the moment variance is statistically likely to mean-revert.
Barberis, Shleifer, and Vishny modeled the psychological mechanisms behind both patterns: investors exhibit what looks like momentum behavior (weighting recent trends as if they will continue) and reversal behavior (expecting a correction after extended runs), depending on the length and salience of the recent sequence [3]. The common thread is that recent data is over-weighted relative to the base rate. For a trader, both versions produce the same class of error: decisions driven by the last handful of trades rather than the full log.
The fingerprint in your trade log
Recency bias leaves measurable patterns. If you have a log with position sizing and trade-level outcomes, several signals are worth checking.
- Size drift after streaks. Does your position size change significantly following a run of wins or losses? If you are sizing down after losses and up after wins in ways not tied to volatility or pre-set rules, recency bias is acting on your risk decisions.
- Setup abandonment after single losses. If a setup with positive expectancy over your full log loses on three of the last four attempts, do you stop taking it? Filtering setup performance over a short recent window instead of the full sample is one of the cleanest recency fingerprints.
- Holding time compression after bad sessions. Some traders cut winners short following a losing period — avoiding the risk of reversal because the last few winners reversed. If your average holding time for winning trades shortens after losing streaks, recency is reshaping your exit behavior.
- Strategy pivots after short losing runs. The most expensive version: abandoning or substantially revising a system based on a small-sample losing run that falls within the normal variance of the strategy’s historical results.
How to counter it
Anchor decisions to the full sample
When you are deciding whether a setup is still worth taking, or whether to adjust sizing, ask explicitly: what does this setup return over the full log, not over the last two weeks? The recent run is data, but it is a small fraction of your total evidence. A setup with 60 positive-expectancy trades behind it and three recent losses is still supported by 60 trades. The three losses update the picture slightly; they do not overturn it.
This means the full log needs to be in a form you will actually consult under pressure. A memory of your last ten trades is not the same instrument.
Pre-set sizing rules tied to something objective
The most direct counter to recency-driven size drift is to remove discretion from the sizing decision. Set a rule before the session — or before the week — that ties position size to something objective: the trade’s specific risk/reward geometry, a volatility-adjusted formula, or a fixed-fractional rule. A pre-set rule is immune to how this week’s run felt. A sizing decision made in the moment, after a losing streak, is not.
Separate the review of results from decisions about whether to continue
The weekly review is the right place to update your read on a strategy — not mid-session and not immediately after a losing trade. When you review, look at the full sample, note the recent period as one data point, and ask whether the recent results are consistent with normal variance around the strategy’s historical expectancy. If the answer is yes, the strategy continues. If something structural has changed — market regime shift, the setup is now crowded, execution has degraded — that is a real reason to adjust. A short losing run is not.
The measurement layer
Countering recency bias requires seeing the full sample clearly — and doing that under pressure, mid-week, when recent losses are emotionally prominent, is the hard part. The full log needs to be in front of you, not reconstructed from memory.
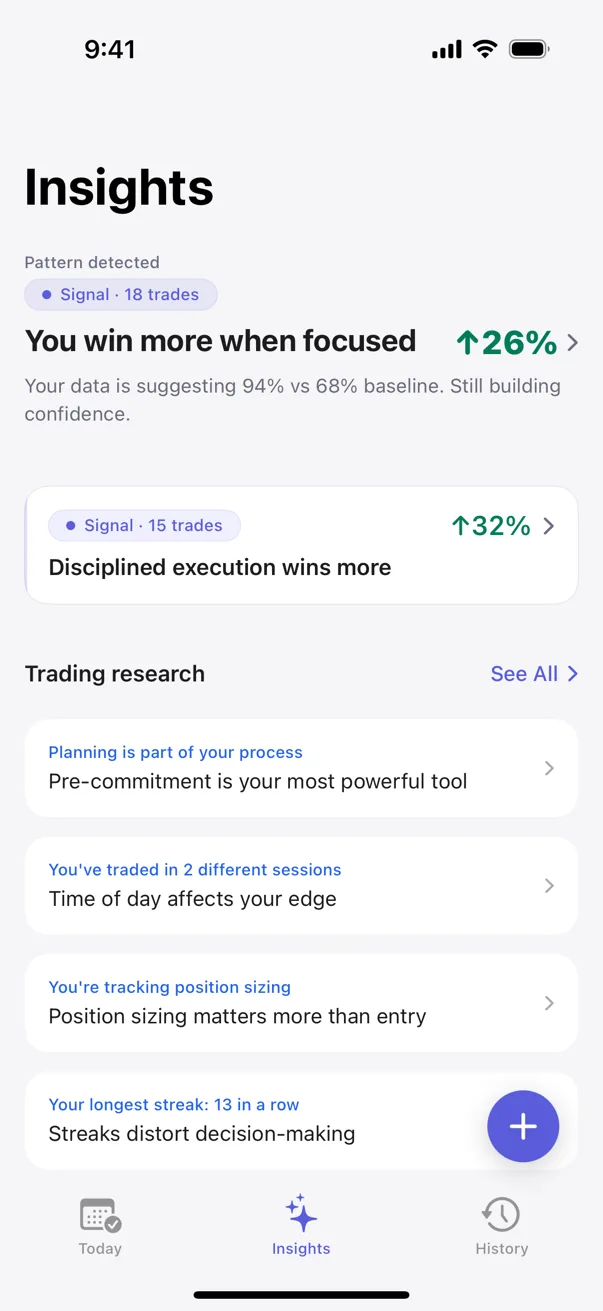
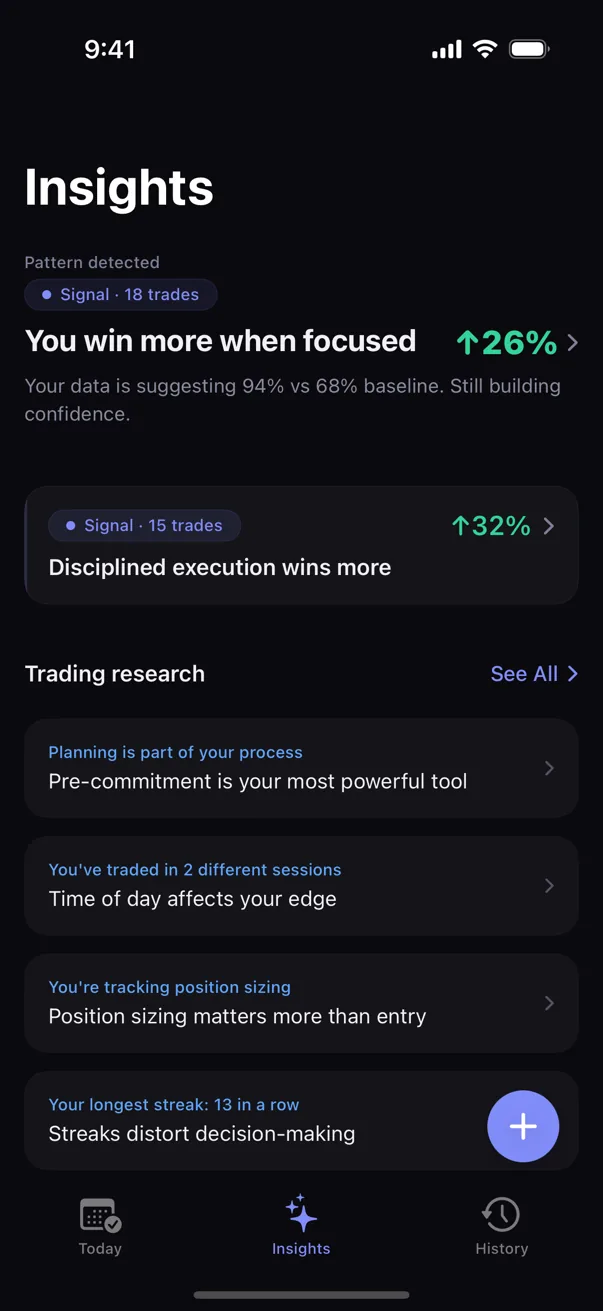
Kyra Trading logs every trade and runs pattern detection across the full history. When you review a setup’s performance, the analysis covers every logged trade for that setup, not the most recent handful. Pattern surfaces use Bayesian inference and Fisher’s exact test to establish whether a pattern is real or within the noise of a small sample — and the confidence tiers (Tracking, Hint, Signal, Proven) reflect how much evidence sits behind each finding. A setup that lost on three of the last four attempts might be in Tracking: not yet enough data to rule either way. A setup with Proven status behind it, based on sixty trades, is not made uncertain by the last three.
The pre-trade checklist captures your intended position size before the trade is live, which means the log can compare stated size to actual size over time. If your stated sizes are consistent but your actual sizes drop after losing runs, that gap is visible as a number — not a feeling. Recency bias cannot hide from a record that covers the full sequence.
Kyra runs all detection on-device. Nothing leaves your phone — no accounts, no servers, no shared data. The full log stays private and the patterns stay yours.
Sources
- Tversky, A., & Kahneman, D. (1973). Availability: A heuristic for judging frequency and probability. Cognitive Psychology, 5(2), 207–232.
- Greenwood, R., & Shleifer, A. (2014). Expectations of Returns and Expected Returns. Review of Financial Studies, 27(3), 714–746.
- Barberis, N., Shleifer, A., & Vishny, R. (1998). A model of investor sentiment. Journal of Financial Economics, 49(3), 307–343.
Educational only. Not financial or trading advice. Behavioral patterns described above are observations from the published literature; specific outcomes vary with strategy, market conditions, and individual circumstances.